

Executive Summary & Core Thesis
Crypto market cycles represent the multi-year regimes of speculative expansion, distribution, cyclical contraction, and long-term accumulation that characterize the digital asset market. While traditional equities and real estate evolve along extended demographic and business cycles, cryptocurrency markets have historically moved along a recurring, roughly four-year rhythmic cadence.
This structural cadence is shaped by the interaction of four fundamental market forces:
- Programmatic Emission Schedules: The Bitcoin block subsidy halving occurring roughly every four years, which systematically reduces gross new coin issuance every 210,000 blocks.
- Global Central Bank Net Liquidity: The expansion or contraction of fiat base money, commercial bank reserves, and short-term debt plumbing (most notably tracked via the Federal Reserve’s balance sheet, Treasury General Account, and Overnight Reverse Repo facility).
- Market Psychology & Leverage Microstructure: Behavioral shifts swinging from extreme pessimism to speculative optimism, amplified by perpetual futures leverage and credit cycles.
- Institutional Capital Integration: The structural expansion of regulated capital access rails, including spot exchange-traded products (ETPs), corporate balance-sheet allocations, and institutional custody.
An essential foundation of modern digital asset analysis is that the Bitcoin halving alone does not guarantee a bull market. The halving constrains gross new issuance, but sustained multi-year bull runs require liquidity demand. When programmatic supply reductions coincide with accommodative financial conditions and expanding capital access, asset valuations can experience substantial upward expansion. Conversely, tighter monetary conditions and unwinding speculative leverage can contribute to cyclical contractions in crypto assets. Navigating these regimes requires understanding structural on-chain indicators, derivatives market positioning, and cross-asset risk transmission.
Executive Summary & Core Thesis
Quick Answer: What Are Crypto Market Cycles?
A crypto market cycle is a multi-year economic pattern typically consisting of four phases: Accumulation (gradual absorption of supply after prolonged weakness), Markup (an expansionary bull market driven by supply constraints and liquidity inflows), Distribution (profit-taking at cycle tops), and Markdown (a cyclical bear market marked by leverage flushes and crypto winters). Historically, these cycles have often interacted with the Bitcoin halving schedule, while global liquidity, market psychology, institutional flows, and leverage conditions can materially influence their timing and magnitude.
To analyze digital asset cycles with institutional precision, market participants evaluate how supply and liquidity forces converge across market phases:
                      ┌─────────────────────────────────────────┐
                      │    THE 4-STAGE CRYPTO MARKET CYCLE      │
                      └────────────────────┬────────────────────┘
                                           │
         ┌─────────────────────────────────┴─────────────────────────────────┐
         │                                                                   │
         ▼                                                                   ▼
┌──────────────────────────────────┐               ┌──────────────────────────────────┐
│ STAGE 1: THE SUPPLY CONSTRAINT   │               │ STAGE 2: THE LIQUIDITY INFLOW    │
├──────────────────┤               ├──────────────────────────────────┤
│ * Programmatic Bitcoin halving   │               │ * Global fiat liquidity easing   │
│ * New BTC issuance falls by 50%  │               │ * Central bank reserve expansion │
│   (Gross new supply halves)      │               │ * Institutional spot ETP inflows │
└──────────────────┘               └──────────────────────────────────┘
                                           │
                                           ▼
┌──────────────────────────────────┐               ┌──────────────────────────────────┐
│ STAGE 4: THE LEVERAGE FLUSH      │               │ STAGE 3: THE SPECULATIVE PEAK    │
├──────────────────┤               ├──────────────────────────────────┤
│ * Cascading perpetual-futures    │               │ * Altcoin rotation & retail mania│
│   liquidations                   │               │ * Elevated funding rate premiums │
│ * Distressed entities liquidate  │               │ * Long-term / informed           │
│ * Deep historical drawdowns      │               │   participant distribution phase │
└──────────────────┘               └──────────────────────────────────┘
Because Bitcoin is the largest and most widely followed crypto asset, its cyclical trajectory can materially influence the broader digital-asset ecosystem and is increasingly analyzed alongside macro-sensitive assets such as equities and precious metals, as contextualized in our foundational guide on what is bitcoin.
Foundational Definition: What Is a Market Cycle?
In financial market theory, a market cycle represents the natural fluctuation of an asset class between periods of economic expansion and contraction. The classical Wyckoff Method—developed by Richard Wyckoff—identifies four structural regimes based on institutional supply and demand dynamics:
                      ┌─────────────────────────────────────────┐
                      │    THE WYCKOFF MARKET CYCLE FRAMEWORK   │
                      └────────────────────┬────────────────────┘
                                           │
         ┌───────────────────┬─────────────┴───────┬───────────────────┐
         ▼                   ▼                     ▼                   ▼
┌─────────────────┐ ┌─────────────────┐   ┌─────────────────┐ ┌─────────────────┐
│ 1. ACCUMULATION │ │ 2. MARKUP       │   │ 3. DISTRIBUTION │ │ 4. MARKDOWN     │
├─────────────────┤ ├─────────────────┤   ├─────────────────┤ ├─────────────────┤
│ Informed capital│ │ Sustained upward│   │ Profit-taking   │ │ Cyclical down-  │
│ absorption; low │ │ price trend;    │   │ by early buyers;│ trend; panic      │
│ volatility; broad│ expanding volume; │   euphoric retail   │ selling; leverage │
│ market disinterest│ public awareness │   participation     │ liquidations      │
└─────────────────┘ └─────────────────┘   └─────────────────┘ └─────────────────┘
Market Velocity in Digital Assets
While equity and real estate cycles often span 7 to 15 years—buffered by slow corporate balance sheet adjustments, quarterly reporting cycles, and demographic trends—cryptocurrency markets operate on compressed continuous timescales:
- 24/7/365 Continuous Price Discovery: Digital assets trade without market closes, eliminating weekend halts and localized holiday pauses.
- Global Digital Access: Capital enters and exits continuously from retail investors, algorithmic trading desks, and international institutions across every timezone.
- Predetermined Issuance Mechanics: Unlike equities, where management can issue secondary offerings, or fiat currencies with discretionary central bank printing, Bitcoin’s supply emission is governed strictly by cryptographic consensus.
Historically, Bitcoin market cycles have often clustered around the roughly four-year halving cadence, but the timing and duration of accumulation, markup, distribution, and markdown phases have varied materially across cycles.
The 4 Pillars of Crypto Market Cycles: The Quad-Force Dynamic

Crypto market cycles can be analyzed through four interacting pillars:
                      ┌─────────────────────────────────────────┐
                      │    THE FOUR PILLARS OF CRYPTO CYCLES    │
                      └────────────────────┬────────────────────┘
                                           │
         ┌───────────────────┬─────────────┴───────┬───────────────────┐
         ▼                   ▼                     ▼                   ▼
┌─────────────────┐ ┌─────────────────┐   ┌─────────────────┐ ┌─────────────────┐
│ PILLAR 1:       │ │ PILLAR 2:       │   │ PILLAR 3:       │ │ PILLAR 4:       │
│ CENTRAL BANK    │ │ BITCOIN HALVING │   │ BEHAVIORAL      │ │ INSTITUTIONAL   │
│ NET LIQUIDITY   │ │ SUPPLY SHOCKS   │   │ PSYCHOLOGY & OI │ │ CAPITAL ADOPTION│
├─────────────────┤ ├─────────────────┤   ├─────────────────┤ ├─────────────────┤
│ Global fiat M2, │ │ Quadrennial cut │   │ Fear & Greed,   │ │ Regulated ETPs, │
│ Fed Balance     │ │ in daily gross  │   │ perpetual       │ │ corporate balance│
│ Sheet, TGA and  │ │ issuance from   │   │ funding rates,  │ sheet reserves,   │
│ RRP dynamics    │ │ 900 to 450 BTC  │   │ and leverage    │ and custody rails │
└─────────────────┘ └─────────────────┘   └─────────────────┘ └─────────────────┘
- Pillar 1: Central Bank Net Liquidity: As explored in our manual on Fed rate cuts and global liquidity, Bitcoin is highly sensitive to global liquidity and financial conditions, but its price is also influenced by supply dynamics, institutional flows, leverage, regulation, adoption, and crypto-specific market events. When central banks expand balance sheets, ease policy rates, or when previously parked liquidity moves into other financial assets, broader financial conditions can become more supportive of risk-asset valuations, although the relationship varies by market regime.
- Pillar 2: The Programmatic Halving Supply Shock: Every 210,000 blocks (~4 years), Bitcoin’s emission rate is reduced by 50%. This reduces the rate at which new Bitcoin enters circulation and can reduce the amount of newly mined BTC that miners may need to sell, although miner selling behavior varies with profitability, balance-sheet strategy, and market conditions.
- Pillar 3: Behavioral Psychology & Derivatives Leverage: Market participants swing between cyclical emotional extremes—from the despair of deep bear markets to the extreme speculative optimism of market peaks. This psychological pendulum is amplified by derivatives markets, where over-leveraged perpetual futures contracts trigger systemic liquidation cascades.
- Pillar 4: Institutional Capital Access: Early cycles (2011–2017) were heavily influenced by retail participation and a relatively fragmented exchange ecosystem, while modern cycles increasingly incorporate regulated institutional access rails—including spot exchange-traded products (ETPs) holding substantial physical reserves, corporate treasury reserves, and institutional custodians, as documented in our guide on what is a bitcoin etf.
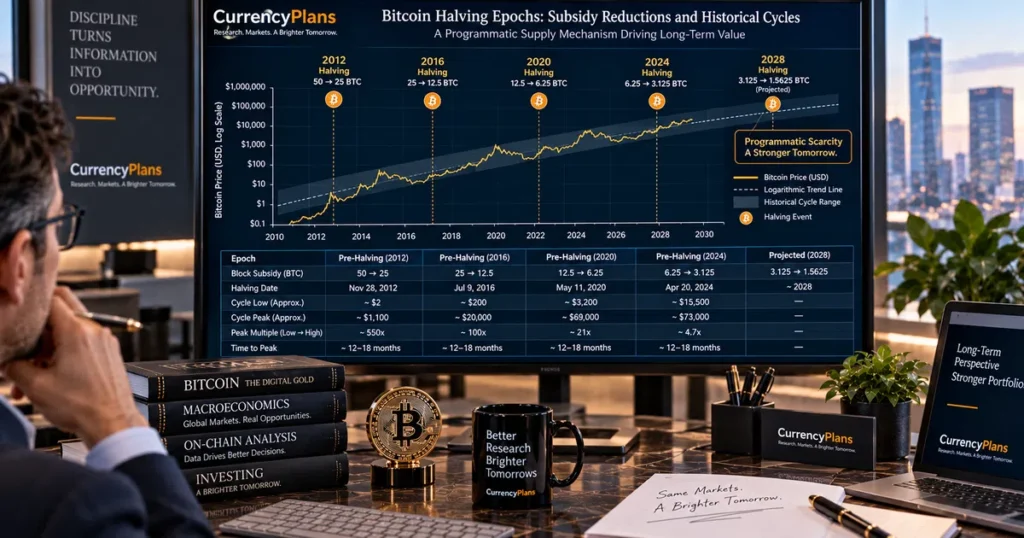
The Bitcoin Halving Mechanism: The Programmatic Supply Heartbeat

At the core of the digital asset emission schedule is the Bitcoin Halving—a consensus rule hardcoded into the Bitcoin protocol to enforce a predetermined maximum supply schedule:
                      BITCOIN BLOCK SUBSIDY ISSUANCE SCHEDULE

       Block Reward (BTC)
         50.00 │ ══════ (2009-2012: Genesis Epoch)
         25.00 │        └────── ══════ (Epoch 2: 2012-2016)
         12.50 │                       └────── ══════ (Epoch 3: 2016-2020)
          6.25 │                                      └────── ══════ (Epoch 4: 2020-2024)
          3.125│                                                     └────── ══════ (Epoch 5: 2024-2028)
          1.562│                                                                    └────── ══ (2028+)
               └────────────────────────────────────────────────────────────────────────────
                2009    2012            2016            2020            2024            2028
Bitcoin Issuance & Halving Historical Performance Matrix:
| Issuance / Halving Event | Calendar Date | Block Height | Block Subsidy (BTC) | Price at Epoch Start | Cycle Peak (ATH) | Post-Halving Peak Gain | Subsequent Bear Drawdown |
|---|---|---|---|---|---|---|---|
| Genesis Launch / Initial Issuance | Jan 3, 2009 | Block 0 | 50.0 BTC | N/A | $31.91 (2011) | N/A | -93.5% |
| 1st Halving | Nov 28, 2012 | Block 210,000 | 25.0 BTC | ~$12.35 | $1,163 (Nov 2013) | +9,317% | -86.9% ($152) |
| 2nd Halving | Jul 9, 2016 | Block 420,000 | 12.5 BTC | ~$650 | $19,666 (Dec 2017) | +2,925% | -84.1% ($3,122) |
| 3rd Halving | May 11, 2020 | Block 630,000 | 6.25 BTC | ~$8,820 | $69,000 (Nov 2021) | +682% | -77.5% ($15,476) |
| 4th Halving | Apr 20, 2024 | Block 840,000 | 3.125 BTC | ~$63,800 | Dynamic 2025/2026 Peak | Evolving | Dynamic |
| 5th Halving (Projected) | ~April 2028 | Block 1,050,000 | 1.5625 BTC | Projected | Not predictable | Not predictable | Not predictable |
Capital Scaling and Percentage Returns
The declining percentage gains across historical Bitcoin cycles are consistent with a larger market capitalization and deeper liquidity base:
- In Bitcoin’s early market phases, its relatively small market capitalization meant that comparatively modest changes in aggregate demand could produce very large percentage price movements.
- As Bitcoin’s market capitalization has grown into the multi-trillion-dollar range, substantially greater aggregate demand and liquidity are generally required to sustain similarly large percentage moves.
The 4 Phases of Market Cycles: Wyckoff Schematics & Structural Evolution

Crypto market cycles can be analyzed through four recurring structural phases characterized by different on-chain metrics, capital flows, and psychological states:
                      ┌─────────────────────────────────────────┐
                      │    THE CIRCULAR CYCLE ARCHITECTURE      │
                      └────────────────────┬────────────────────┘
                                           │
         ┌─────────────────────────────────┴─────────────────────────────────┐
         │                                                                   │
         ▼                                                                   ▼
┌──────────────────────────────────┐               ┌──────────────────────────────────┐
│ PHASE 1: ACCUMULATION            │               │ PHASE 2: MARKUP                  │
├──────────────────┤               ├──────────────────────────────────┤
│ * MVRV Ratio in stressed zone    │               │ * MVRV rises into elevated zones │
│ * NUPL in capitulation/despair   │               │ * NUPL expands into belief/greed │
│ * Volatility reaches multi-yr low│               │ * New capital enters the market  │
│ * Informed capital absorbs supply│               │ * Significant price expansion    │
└──────────────────┘               └──────────────────────────────────┘
                                           │
                                           ▼
┌──────────────────────────────────┐               ┌──────────────────────────────────┐
│ PHASE 4: MARKDOWN                │               │ PHASE 3: DISTRIBUTION            │
├──────────────────┤               ├──────────────────────────────────┤
│ * Selling pressure and liquidations              │ * Sustained profit-taking        │
│ * High-profile insolvencies occur│               │ * Speculative leverage builds up │
│ * Stressed miners reduce capacity│               │ * High volatility without new highs│
│ * Extended cyclical drawdown     │               │ * Complacency shifts into anxiety│
└──────────────────┘               └──────────────────────────────────┘
1. Phase 1: Accumulation (The Foundation)
- Psychological State: Disbelief, exhaustion, disinterest. Public sentiment declares the asset class failed.
- Market Characteristics: Volatility declines toward historical lows. Trading volume dries up on centralized exchanges.
- On-Chain Profile: MVRV enters historically stressed zones (< 1.0), indicating aggregate market value is below realized value. Such conditions have historically overlapped with periods of long-term accumulation and distressed selling. Net Unrealized Profit/Loss (NUPL) turns negative.
2. Phase 2: Markup (The Expansion)
- Psychological State: Optimism $\rightarrow$ Belief $\rightarrow$ Elevated Greed.
- Market Characteristics: Post-halving supply reductions can interact with improving liquidity and broader demand conditions. Bitcoin can reclaim and eventually surpass previous all-time highs, often attracting mainstream media coverage and additional market participation.
- On-Chain Profile: MVRV rises into historically elevated zones (> 2.5 to 3.5). The 200-week moving average heatmap shifts toward elevated bands. Funding rates on major perpetual-futures venues can become persistently elevated during crowded long positioning; the magnitude and funding interval vary by exchange and contract.
3. Phase 3: Distribution (The Late-Stage Top)
- Psychological State: Complacency and speculative fever. Narratives emerge claiming severe bear markets are permanently obsolete.
- Market Characteristics: Heavy trading volume accompanied by stalling upward momentum. Early investors, venture funds, miners, and other long-term holders may distribute accumulated inventory to later market participants.
- On-Chain Profile: Divergences form between price advances and momentum indicators. Exchange inflows rise as older coins move on-chain to be liquidated.
4. Phase 4: Markdown (The Cyclical Deleveraging)
- Psychological State: Denial $\rightarrow$ Anxiety $\rightarrow$ Capitulation.
- Market Characteristics: Technical breakdowns trigger cascading liquidations on derivatives exchanges. Over-leveraged trading desks, speculative lenders, and inefficient miners face margin calls and forced selling.
- On-Chain Profile: Realized losses can spike as distressed participants exit positions, while prolonged weakness can also pressure higher-cost miners and contribute to further deleveraging, helping reset speculative positioning and market conditions.
The Capital Flow Cascade: From Bitcoin Dominance to Altcoin Season

Capital does not enter cryptocurrency markets uniformly. It can follow recurring risk-rotation patterns, although the sequence and intensity vary across cycles:
             ┌─────────────────────────────────────────┐
             │ THE 4-STAGE ILLUSTRATIVE CAPITAL MODEL  │
             └────────────────────┬────────────────────┘
                                  │
   ┌───────────────────┬──────────┴──────────┬───────────────────┐
   ▼                   ▼                     ▼                   ▼


┌─────────────────┐ ┌─────────────────┐ ┌─────────────────┐ ┌─────────────────┐
│ STAGE 1: │ │ STAGE 2: │ │ STAGE 3: │ │ STAGE 4: │
│ BITCOIN LEADS │ │ ETHEREUM & │ │ BROAD ALTCOIN │ │ DELEVERAGING & │
│ THE ADVANCE │ │ MAJOR LAYER-1S │ │ EXPANSION │ │ DEFENSIVE SHIFT │
├─────────────────┤ ├─────────────────┤ ├─────────────────┤ ├─────────────────┤
│ Bitcoin surges; │ │ Capital rotates │ │ Multiple │ │ Speculative │
│ Bitcoin │ │ into ETH, SOL, │ │ expansion in │ │ cycle corrects; │
│ Dominance │ │ and large-cap │ │ mid-caps, │ │ alts decline; │
│ (BTC.D) rises │ │ networks; BTC.D │ │ small-caps and │ │ capital rotates │
│ as Bitcoin leads│ │ peaks and stalls│ │ niche tokens; │ │ to BTC, stables │
│ the broader │ │ │ │ BTC.D drops │ │ or cash │
│ market │ │ │ │ │ │ │
└─────────────────┘ └─────────────────┘ └─────────────────┘ └─────────────────┘
The Altcoin Season Index Explained
Market participants can track this rotation using indicators such as the Altcoin Season Index:
- Bitcoin Season (< 25 on Index): Bitcoin significantly outperforms the broader crypto complex. Capital remains concentrated in the benchmark asset.
- Neutral Zone (25–75 on Index): Selected large-cap protocols keep pace with Bitcoin.
- Altcoin Season (> 75 on Index): Defined by the CoinMarketCap Altcoin Season Index when 75% of the top 100 eligible cryptocurrencies outperform Bitcoin over a rolling 90-day period (excluding stablecoins and asset-backed tokens).
Altcoin seasons can follow a risk-rotation pattern in which Bitcoin leads, followed in some cycles by Ethereum and other major networks, before speculative capital moves into smaller or higher-beta tokens, as explored in our guide on what is ethereum. When market participants experience substantial gains in Bitcoin, they often rotate profits into higher-beta assets seeking additional percentage appreciation, marking late-stage speculative activity. During cycle corrections, this speculative rotation typically unwinds as capital seeks defensive positioning in Bitcoin, stablecoins, or fiat equivalents.
Macroeconomic Plumbing: Global Central Bank Net Liquidity vs. Crypto

A widely used framework in digital-asset analysis is the relationship between Bitcoin prices and global liquidity conditions. A commonly used market-analysis proxy for U.S. net liquidity is:
$$\text{Net Liquidity Proxy} = \text{Fed Total Assets} – \text{Treasury General Account (TGA)} – \text{Overnight Reverse Repo (ON RRP)}$$
Note: This is an analytical framework rather than an official Federal Reserve measure, and it does not represent global liquidity by itself.
                     ┌─────────────────────────────────────────┐
                     │    LIQUIDITY REGIME INTERACTION         │
                     └────────────────────┬────────────────────┘
                                          │
        ┌─────────────────────────────────┴─────────────────────────────────┐
        │                                                                   │
        ▼                                                                   ▼
┌──────────────────────────────────┐               ┌──────────────────────────────────┐
│ LIQUIDITY EXPANSION (2020-2021)  │               │ LIQUIDITY CONTRACTION (2022)     │
├──────────────────┤               ├──────────────────────────────────┤
│ * Quantitative easing + 0% rates │               │ * Rapid Fed policy rate hikes    │
│ * Fiat money supply expands      │               │ * Quantitative Tightening (QT)   │
│ * Net Liquidity proxy expands    │               │ * ON RRP usage remained elevated,│
│ * Observed outcome: BTC rallied  │               │   reaching roughly $2.2T in 2022 │
│   from ~$3k to $69k amid easing  │               │ * Observed outcome: BTC          │
│   and crypto-specific catalysts  │               │   retraced to ~$15k              │
└──────────────────┘               └──────────────────────────────────┘
The 2023–2024 Balance Sheet Dynamics
During 2023 and 2024, Bitcoin rebounded from $15,000 to new highs above $70,000 despite the Federal Reserve executing Quantitative Tightening (QT). A significant contributing factor was the behavior of the Overnight Reverse Repo (ON RRP) facility:
- As ON RRP balances declined substantially from their 2023 peak toward very low levels by 2026, money-market funds shifted funds toward Treasury bills and other short-duration assets.
- Together with Treasury issuance and other balance-sheet flows, this changed the distribution of liquidity within the financial system and helped support commercial bank reserve balances relative to what would otherwise have occurred under the same level of Fed asset holdings.
Crypto market cycles are meaningfully influenced by monetary conditions, financial liquidity, and broader risk appetite.
Miner Economics: Daily Issuance, Hash Price, and Capitulation Dynamics

Bitcoin miners represent recurring market participants who must cover ongoing operational capital expenditures:
                      DAILY GROSS NEW BITCOIN ISSUANCE

       Pre-April 2024 Halving (6.25 BTC/block):
       At the protocol's 10-minute target interval, the approximate average is 144 blocks/day:
       Approx. 144 blocks/day * 6.25 BTC ≈ 900 BTC gross new issuance daily
       At $65,000/BTC ≈ ~$58.5 Million in daily gross newly minted value
         │
         ▼ (April 20, 2024 Halving Event)
         │
       Post-April 2024 Halving (3.125 BTC/block):
       Approx. 144 blocks/day * 3.125 BTC ≈ 450 BTC gross new issuance daily
       At $65,000/BTC ≈ ~$29.25 Million in daily gross newly minted value
         │
       Gross New Issuance Reduction: ~450 BTC per day (~13,500 BTC per 30-day period)
The Miner Operational Cycle
- The Block Subsidy Reduction: Overnight, gross block subsidy revenue per block is cut in half, while operational expenses (electricity, hardware debt, facility maintenance) remain constant.
- Margin Adjustments: Operators running older-generation ASIC hardware see their production costs rise relative to current market prices, as detailed in our guide on what crypto mining is.
- Operational Stress: Inefficient mining operations may face cash flow compression, which can increase selling pressure and financial stress among higher-cost miners during periods of weak prices.
- Difficulty Recalibration: If uncompetitive miners disconnect hardware, network hash rate contracts, reducing network difficulty and improving the economics of the remaining operators, all else equal. The reduction in new issuance establishes the lower-emission baseline for the next halving epoch.
Institutional On-Chain Valuation Architecture: Top & Bottom Frameworks

Digital-asset analysts and investors use on-chain accounting metrics to compare network valuation with historical baseline bands. The thresholds below are illustrative historical stress and elevation zones rather than universal buy, sell, or cycle-timing rules:
+---------------------------------------------------------------------------------------------------+
|                        ILLUSTRATIVE HISTORICAL STRESS / ELEVATION ZONES                           |
+---------------------+-------------------------------+---------------------+-----------------------+
| ON-CHAIN METRIC     | UNDERLYING CALCULATION        | HISTORICALLY        | HISTORICALLY          |
|                     |                               | STRESSED ZONE       | ELEVATED ZONE         |
+---------------------+-------------------------------+---------------------+-----------------------+
| **MVRV Ratio**      | Market Cap / Realized Cap     | **< 1.0**           | **> 3.5**             |
|                     | (Market vs Realized Value)    | (Market Below Cost) | (Elevated Valuation)  |
| **NUPL**            | (Market Cap - Realized Cap)   | **< 0.0**           | **> 0.75**            |
|                     | / Market Cap                  | (Capitulation/Loss) | (Elevated Greed)      |
| **Puell Multiple**  | Daily Mining Issuance USD     | **< 0.5**           | **> 3.0 - 4.0**       |
|                     | / 365-Day Moving Avg Revenue  | (Revenue Stressed)  | (Elevated Revenue)    |
| **200-Week MA**     | Spot Price vs 200W Moving     | **Touching or Below**| **Substantially Above**|
| **Heatmap**         | Average structural baseline   | (Structural Base)   | (Overextended Trend)  |
| **Crypto Fear &**   | Multi-factor behavioral model | **< 20**            | **> 80 - 90**         |
| **Greed Index**     | (Alternative.me Index)        | (Extreme Fear)      | (Extreme Greed)       |
+---------------------+-------------------------------+---------------------+-----------------------+
Historical Case Studies:
- The November 2022 Cycle Trough: Following the collapse of FTX, Bitcoin traded near $15,500. Depending on the data provider and methodology, MVRV entered deeply depressed historical territory below 1.0, NUPL dropped into negative territory, and the Fear & Greed Index touched 12 (Extreme Fear). Several widely followed on-chain and sentiment metrics were in historically depressed zones.
- The November 2021 Cycle Peak: When Bitcoin reached $69,000, MVRV reached elevated historical levels above 3.5 in many widely followed datasets, long-term holder distribution accelerated, and on-chain realized profit metrics reached elevated levels.
Derivatives Microstructure: Perpetual Funding Rates and Leverage Cascades

In modern cycles, secondary market volatility is heavily influenced by the crypto derivatives complex—primarily Perpetual Futures Contracts:
                      ┌─────────────────────────────────────────┐
                      │    THE PERPETUAL LEVERAGE CYCLE         │
                      └────────────────────┬────────────────────┘
                                           │
         ┌─────────────────────────────────┴─────────────────────────────────┐
         │                                                                   │
         ▼                                                                   ▼
┌──────────────────┐               ┌──────────────────────────────────┐
│ ELEVATED LONG PREMIUMS           │               │ PERSISTENT SHORT DISCOUNT        │
├──────────────────┤               ├──────────────────────────────────┤
│ * Funding rate becomes elevated  │               │ * Funding rate turns negative    │
│   (Longs pay shorts)             │               │   (Shorts pay longs)             │
│ * Open Interest expands rapidly  │               │ * Crowded short positioning      │
│ * Sharp downside movements can   │               │ * Upward price shocks can force  │
│   trigger cascading liquidations │               │   short covering squeezes        │
└──────────────────┘               └──────────────────────────────────┘
The Funding Rate Mechanism:
Perpetual contracts use periodic funding payments to help keep contract prices aligned with spot prices. Funding intervals vary by exchange and contract; 8 hours is a common interval on major venues:
- Elevated Positive Funding: When funding rates trade significantly above baseline levels, leveraged long positions are paying premiums to maintain exposure, indicating crowded bullish sentiment that is vulnerable to cascading long liquidations during sudden downturns.
- Negative Funding: When funding rates turn persistently negative during sell-offs, short positions pay premiums to longs, reflecting crowded bearish sentiment that can fuel sharp short-squeeze rallies.
Historical Bull Market Archetypes: Catalysts and Drivers
Major Bitcoin bull markets have featured different combinations of structural catalysts:
+---------------------------------------------------------------------------------------------------+
|                        REPRESENTATIVE STRUCTURAL DRIVERS ACROSS BULL CYCLES                       |
+---------------------+-----------------------------+-----------------------+-----------------------+
| MARKET PHASE        | MAJOR CONTRIBUTING DRIVERS  | CORE NARRATIVE        | PRICE TRAJECTORY      |
+---------------------+-----------------------------+-----------------------+-----------------------+
| **2016 - 2017**     | **Retail Adoption & ICOs**  | "Smart Contracts and  | ~$650 -> $19,666      |
|                     |                             | Decentralized Apps"   |                       |
| **2020 - 2021**     | **Macro Fiat Liquidity**    | "Store of Value; Zero | ~$8,800 -> $69,000    |
|                     | **& Corporate Reserves**    | Interest Rates"       |                       |
| **2024 - 2026**     | **Institutional Spot ETPs** | "Regulated Clearing;  | ~$63,800 -> Dynamic   |
| (Adoption Phase)    | **& Wealth Advisory Access**| Wealth Management"    |                       |
+---------------------+-----------------------------+-----------------------+-----------------------+
- The 2017 Retail Cycle: Characterized by widespread retail onboarding, the emergence of Ethereum smart contracts, and unvetted token fundraising, leading to broad-based altcoin speculation.
- The 2020–2021 Liquidity Cycle: Catalyzed by global central bank balance-sheet expansions, fiscal stimulus, near-zero interest rates, and initial corporate balance-sheet purchases.
- The 2024–2026 Institutional Adoption Phase: Anchored by regulated spot ETPs, registered wealth management platform integrations, listed options markets, and corporate treasury adoption.
Historical Bitcoin Bear-Market Drawdowns
The counterpart to the crypto bull market is the cyclical markdown (crypto winter):
                      ┌─────────────────────────────────────────┐
                      │    ANATOMY OF A CYCLICAL DOWNTURN       │
                      └────────────────────┬────────────────────┘
                                           │
         ┌───────────────────┬─────────────┴───────┬───────────────────┐
         ▼                   ▼                     ▼                   ▼
┌─────────────────┐ ┌─────────────────┐   ┌─────────────────┐ ┌─────────────────┐
│ 1. REGULATORY & │ │ 2. SYSTEMIC     │   │ 3. MACRO        │ │ 4. PROLONGED    │
│ STRUCTURAL      │ │ CREDIT UNWINDS  │   │ LIQUIDITY DRAIN │ │ ACCUMULATION    │
├─────────────────┤ ├─────────────────┤   ├─────────────────┤ ├─────────────────┤
│ Historical      │ │ Overextended    │   │ Central banks   │ Trading volumes   │
│ exchange hacks  │ │ lenders and     │   │ tighten credit; │ decline; market   │
│ or regional     │ │ algorithms fail │   │ interest rates  │ volatility        │
│ restrictions    │ │ (e.g. 2022)     │   │ rise globally   │ flattens          │
└─────────────────┘ └─────────────────┘   └─────────────────┘ └─────────────────┘
Major Historical Drawdown Profiles:
Major historical Bitcoin bear markets have produced exceptionally large drawdowns, although the magnitude has varied across cycles:
- 2013–2015 Downturn: Retraced from $1,163 to $152 (-86.9% peak-to-trough).
- 2017–2018 Downturn: Retraced from $19,666 to $3,122 (-84.1% peak-to-trough).
- 2021–2022 Downturn: Retraced from $69,000 to $15,476 (-77.5% peak-to-trough).
Unlike traditional banking systems, Bitcoin itself does not have a central-bank lender of last resort. When highly leveraged crypto entities fail, losses are generally resolved through market repricing, liquidation, restructuring, or bankruptcy rather than through a Bitcoin-native monetary backstop. These processes can contribute to deep drawdowns, but they do not establish a fixed bottom based on mining costs.
The Cycle Evolution Debate: 4-Year Cadence vs. Lengthening Cycles
As institutional participation expands, there is ongoing debate over whether the historical 4-year cycle will persist in its traditional form:
                      THE THREE CYCLE EVOLUTION THESES

       THESIS A: The 4-Year Cadence Remains Dominant
       The programmatic halving schedule continues to align with cyclical supply shifts,
       reinforcing the pattern of accumulation, markup, distribution, and markdown.
         │
       THESIS B: Lengthening Cycles and Diminishing Returns
       As market capitalization grows into multi-trillion-dollar scale, each expansion requires
       more capital and time to develop, potentially extending cycle durations.
         │
       THESIS C: The Institutional Super-Cycle / Structural Floor Thesis
       Some proponents argue that continuous institutional inflows from spot ETPs and corporate
       treasuries will dampen downside volatility and prevent severe historical drawdowns.
While institutional spot ETPs provide continuous capital access, the hypothesis that digital assets will avoid significant bear markets has appeared near the peak of previous cycles. Digital assets remain risk-sensitive instruments that interact with broader macroeconomic liquidity conditions.
7 Historical Signals Sometimes Associated with Cycle Tops
Assessing potential cycle tops involves monitoring quantitative indicators for signs of speculative overextension:
+---------------------------------------------------------------------------------------------------+
|                  7 HISTORICAL SIGNALS SOMETIMES ASSOCIATED WITH CYCLE TOPS                        |
+---+-----------------------------+-----------------------------------------------------------------+
| # | SIGNAL CATEGORY             | HISTORICAL RISK ZONE / OBSERVATION                              |
+---+-----------------------------+-----------------------------------------------------------------+
| 1 | **On-Chain MVRV Ratio**     | MVRV rises above **3.5**, reflecting elevated unrealized gains  |
| 2 | **NUPL Sentiment Matrix**   | NUPL enters the upper **"Euphoria/Greed" zone (> 0.75)**        |
| 3 | **Perpetual Funding Rates** | Funding rates remain persistently elevated across major venues  |
| 4 | **Altcoin Season Index**    | Index crosses **75–85+**, with high turnover in speculative tokens|
| 5 | **Bitcoin Dominance Shifts**| BTC.D declines rapidly as capital rotates into lower-tier assets|
| 6 | **Dormant Coin Movement**   | Long-dormant coins (3+ years) move onto exchanges at higher rates|
| 7 | **Search & Retail Interest**| Search volume and retail app downloads surge toward record peaks|
+---+-----------------------------+-----------------------------------------------------------------+
7 Historical Signals Sometimes Associated with Cycle Bottoms
Conversely, cyclical bottoms are historically characterized by depressed valuations and market apathy:
+---------------------------------------------------------------------------------------------------+
|                 7 HISTORICAL SIGNALS SOMETIMES ASSOCIATED WITH CYCLE BOTTOMS                      |
+---+-----------------------------+-----------------------------------------------------------------+
| # | SIGNAL CATEGORY             | HISTORICAL ACCUMULATION ZONE / OBSERVATION                      |
+---+-----------------------------+-----------------------------------------------------------------+
| 1 | **On-Chain MVRV Ratio**     | MVRV plunges **below 1.0**, indicating market value < realized  |
| 2 | **NUPL Capitulation**       | NUPL turns **negative (< 0.0)**, reflecting widespread losses   |
| 3 | **200-Week MA Heatmap**     | Spot price approaches or undercuts the **200-Week Moving Avg**  |
| 4 | **Perpetual Funding Reset** | Funding becomes persistently negative, showing crowded shorts   |
| 5 | **Puell Multiple**          | Puell Multiple drops **below 0.5**, signaling miner stress      |
| 6 | **Fear & Greed Index**      | Index registers **Extreme Fear (< 20)** over sustained periods  |
| 7 | **Volume Contraction**      | Broad public interest declines; trading volumes reach multi-yr lows|
+---+-----------------------------+-----------------------------------------------------------------+
The Forward Emission Schedule: The 2028 Halving and Beyond
Looking toward the 5th Bitcoin Halving (Block 1,050,000, projected around April 2028), new supply issuance will decrease further:
$$\text{Daily Gross Issuance (2028)} = \text{Approx. 144 blocks} \times 1.5625 \text{ BTC} \approx 225 \text{ BTC per day}$$
                      THE PROGRAMMATIC EMISSION SCHEDULE

       Epoch 4 (2020-2024): Approx. 900 BTC gross issuance daily (~$58.5M/day at $65,000)
       Epoch 5 (2024-2028): Approx. 450 BTC gross issuance daily (~$29.25M/day at $65,000)
       Epoch 6 (2028-2032): Approx. 225 BTC gross issuance daily (~$14.6M/day at $65,000)
       Long-Term Issuance:  More than 97% of Bitcoin's eventual 21 million supply
                            is expected to have been issued by around 2030.
As the block subsidy decreases, network transaction fees will play an increasingly prominent role in supporting miner revenue, highlighting the importance of sustainable base-layer transaction activity and the broader Bitcoin scaling ecosystem. Over time, institutional holding through ETPs, corporate balance sheets, and custodians could reduce the amount of Bitcoin readily available on public exchanges, depending on institutional holding and transfer behavior.
The Cross-Market Correlation Matrix: Crypto vs. Global Equities
Digital assets interact continuously with global capital markets and macro risk sentiment:
+-------------------------------------------------------------------------------+
|                      CROSS-ASSET MACRO RELATIONSHIPS                          |
+----------------------+-----------------------------+--------------------------+
| ASSET CLASS          | ILLUSTRATIVE RELATIONSHIP   | PRIMARY TRANSMISSION     |
+----------------------+-----------------------------+--------------------------+
| **Nasdaq 100 (QQQ)** | **Often positive** during   | Shared sensitivity to the|
|                      | broad risk-on and liquidity | cost of capital and tech |
|                      | regimes                     | equity sentiment         |
| **Gold (GLD)**       | **Variable / regime-**      | Shared store-of-value    |
|                      | **dependent**               | properties during fiat   |
|                      |                             | debasement periods       |
| **US Dollar (DXY)**  | **Often negative** during   | Dollar strength tightens |
|                      | sustained dollar-strength   | international credit and |
|                      | regimes                     | financial conditions     |
+----------------------+-----------------------------+--------------------------+
Because digital assets trade continuously across global time zones, they can incorporate macro and liquidity-related information outside traditional U.S. equity-market hours. When institutional investors reduce risk across portfolios during macroeconomic tightening or financial market stress, high-beta, highly liquid assets are often sold first.
Common Myths vs. Empirical Facts
- Myth: The 4-year halving cycle guarantees an automatic bull market.
- Fact: The halving reduces the rate of new supply entering the market, but its price effect depends on demand, existing inventories, miner behavior, and broader market conditions. A halving alone cannot trigger a bull market during a severe liquidity contraction.
- Myth: When a crypto winter starts, the asset class is permanently dead.
- Fact: Major historical Bitcoin cycles have included extended bear-market drawdowns (-86.9%, -84.1%, -77.5%) that removed speculative excess before new accumulation phases formed.
- Myth: Altcoin season occurs randomly throughout the cycle.
- Fact: Altcoin seasons often follow a risk-rotation pattern where Bitcoin leads the initial phase, followed in some cycles by Ethereum and major networks, before speculative capital moves into higher-beta tokens.
- Myth: Institutional spot ETFs will permanently eliminate bear markets.
- Fact: Spot ETPs provide regulated market access, but institutional participants also manage risk, rebalance portfolios, and reduce exposure during macroeconomic downturns.
- Myth: Cycle tops and bottoms can be timed with precision.
- Fact: On-chain metrics indicate probabilistic risk zones rather than deterministic timing signals. Indicators such as MVRV and NUPL can remain in elevated or depressed territory for extended periods.
Practical Comparison: Multi-Asset Cycle Allocation Modeling
To illustrate how institutional allocators examine risk exposure across different market regimes, review this educational, non-prescriptive asset allocation framework:
+---------------------------------------------------------------------------------------------------+
|               ILLUSTRATIVE MULTI-ASSET EXPOSURE ACROSS REGIMES (EDUCATIONAL ONLY)                 |
+-------------------+--------------------+--------------------+--------------------+----------------+
| CYCLE REGIME      | CORE BITCOIN (BTC) | LARGE-CAP ASSETS   | SPECULATIVE ALTS   | CASH / T-BILLS |
+-------------------+--------------------+--------------------+--------------------+----------------+
| **Accumulation**  | Higher relative    | Moderate allocation| Selective or       | Elevated cash  |
|                   | focus              |                    | minimal            | reserves       |
| **Markup**        | Core foundational  | Increasing weight  | Selective,         | Lower cash     |
|                   | asset              |                    | tactical exposure  | allocation     |
| **Distribution**  | De-risking and     | Locking in capital | Substantially      | Increasing cash|
|                   | taking profit      | gains              | reduced            | buffers        |
| **Markdown**      | Defensive or core  | Reduced            | Minimal or zero    | Highest cash / |
|                   | holding only       |                    |                    | capital defense|
+-------------------+--------------------+--------------------+--------------------+----------------+
Disclaimer: This matrix represents an illustrative conceptual framework for educational analysis and does not constitute personalized investment advice or portfolio management instructions.
Frequently Asked Questions
What are crypto market cycles?
Crypto market cycles are recurring multi-year phases of expansion (bull markets), distribution (peaks), contraction (bear markets), and accumulation (bottoms) that describe recurring patterns in digital-asset price behavior, historically operating on an approximate four-year cadence.
How long does a crypto market cycle last?
Historically, Bitcoin’s major cycle troughs have often occurred around the roughly four-year halving cadence, although the exact interval and phase durations have varied across cycles.
What role does the Bitcoin halving play in market cycles?
The Bitcoin halving cuts the gross block subsidy reward issued to miners in half every 210,000 blocks (~4 years). This reduces the rate of new supply entering the market; its price effect depends on demand, existing inventories, miner behavior, and broader market conditions.
What is a “crypto winter”?
A crypto winter is a prolonged bear market phase characterized by steep price drawdowns, lower trading volumes, reduced venture capital activity, and subdued market participation.
When does “altcoin season” happen?
Altcoin seasons often occur during late-stage cycle expansions. After Bitcoin completes a significant upward advance, capital can rotate into assets such as Ethereum, major layer-1 platforms, and smaller tokens.
What is the MVRV Ratio and how is it used to assess market extremes?
The MVRV (Market Value to Realized Value) Ratio compares Bitcoin’s market capitalization to its realized capitalization (aggregate participant cost basis). Historically, an MVRV below 1.0 has coincided with periods in which market value sat below realized value, while readings above 3.5 have coincided with elevated valuation conditions in some historical datasets. These levels are historical reference zones rather than deterministic cycle signals.
What is NUPL (Net Unrealized Profit/Loss)?
NUPL measures the aggregate unrealized profit or loss across the Bitcoin network. When NUPL drops below zero, the network in aggregate is holding unrealized losses (historically associated with capitulation zones). When NUPL rises above 0.75, it reflects elevated unrealized profit and distribution risk.
How does Federal Reserve liquidity impact crypto cycles?
When Federal Reserve policy and broader financial conditions become more accommodative, liquidity-sensitive and speculative assets such as crypto can benefit, although the relationship is not one-to-one. When liquidity tightens, digital assets often face downward price pressure.
What is the difference between in-kind and cash-settled creation in crypto ETPs?
In a cash-settled model, Authorized Participants provide cash to the fund to purchase Bitcoin through execution agents. In an in-kind model (permitted under updated SEC regulatory orders), Authorized Participants or permitted counterparties deliver physical Bitcoin directly to the trust’s custodial account, which can reduce the need for the trust to source Bitcoin in secondary markets.
Why can crypto bear markets retrace so deeply?
Bitcoin lacks a central-bank lender of last resort. When overextended lenders, leveraged traders, and unprofitable operations face distress, losses are cleared through open-market liquidations and restructurings, leading to pronounced cyclical corrections.
What are perpetual futures funding rates?
Funding rates are periodic payments exchanged between long and short traders in perpetual futures markets to keep contract prices aligned with spot index prices. Persistently elevated positive funding rates indicate crowded long leverage vulnerable to liquidation flushes.
When is the next Bitcoin halving?
The 5th Bitcoin halving will occur at block height 1,050,000, projected to take place around April 2028, reducing the block subsidy from 3.125 BTC to 1.5625 BTC per block.
Strategic Summary & Core Takeaways
Mastering the mechanics of cryptocurrency market cycles requires an objective, multi-variable approach:
- Supply Timing, Liquidity Scale: The 4-year halving schedule sets the rhythm for gross new supply issuance, but broader global liquidity and financial conditions can materially influence the scale and duration of cycle expansions.
- Four Structural Regimes: Crypto cycles can be analyzed through recurring Wyckoff-style phases—Accumulation, Markup, Distribution, and Markdown—each associated with different valuation, participation, and leverage conditions.
- Capital Rotation Patterns: Capital often rotates from Bitcoin into major layer-1 platforms and broader altcoin markets before the entire market resets during cycle drawdowns.
- On-Chain Forensics: Objective metrics—including the MVRV Ratio, NUPL, Puell Multiple, and funding rates—provide quantitative insight across market extremes.
- Maturing Asset Class: While percentage gains have moderated as market capitalization has grown, the expansion of regulated ETPs, institutional custody, and derivatives markets embeds digital assets more deeply within global financial markets.
Next Reading Suggestions
- What Is Bitcoin? The Complete Guide to the First Decentralized Digital Currency
- What Is a Bitcoin ETF? The Complete Guide to Spot ETPs, In-Kind Mechanics, Institutional Custody, and Tax Rules
- Fed Rate Cuts & Global Liquidity: The Complete Guide to Interest Rates, the Fed Balance Sheet, and Asset Markets
- What Is Crypto Mining? A Complete Guide to Proof of Work, ASICs, Pools, and Energy Economics
- What Is a Crypto Wallet? A Complete Guide to Keys, Security, and Storage Types
- What Is Ethereum? The Complete Guide to Smart Contracts, EVM, Staking, and Layer 2 Rollups
- What Is Blockchain? The Complete Guide to Distributed Ledger Technology, Consensus, and Smart Contracts
- What Is Crypto? The Complete Guide to Cryptocurrency, Blockchain, and Digital Assets
- How Stock Prices Are Determined: Market Microstructure, Supply and Demand, and Valuation
- What Is the Stock Market? How Global Equity Markets Work and Allocate Capital
- What Are Stocks? The Complete Guide to Shares, Equity, and Ownership
- What Is Market Capitalization? The Complete Guide to Market Cap, Company Size, and Valuation
- What Is Gold? The Complete Guide to Real Money, Store of Value & Why It Matters
- Interest Rates and Exchange Rates: The Complete Guide to Global Currency Pricing
Author Box & E-E-A-T Verification
Written & Researched By: CurrencyPlans Editorial Research Team
Editorial Review: This research guide is developed in accordance with quantitative finance, macroeconomic liquidity analysis, and on-chain blockchain forensics standards. Historical halving epochs, miner emission schedules, on-chain valuation metrics (MVRV, NUPL, Puell Multiple), and derivatives market structures are cross-referenced with official institutional repositories, protocol consensus documentation, and reputable third-party analytics platforms.
Primary Data Sources & Research Repositories
For on-chain analytics, macroeconomic releases, regulatory documentation, and protocol specifications, consult the following data providers and primary institutional repositories:
- Official U.S. Macroeconomic Data: Federal Reserve Bank of St. Louis (FRED)
- U.S. Regulatory Disclosures & ETP Orders: U.S. Securities and Exchange Commission (SEC)
- Bitcoin Protocol Documentation & Consensus Rules: Bitcoin Core Developer Guide
- International Central-Bank Research & Liquidity Indicators: Bank for International Settlements (BIS)
- On-Chain Analytics & Entity-Adjusted Metrics: Glassnode Studio
- Cryptocurrency Derivatives & Open Interest Data: CoinGlass Market Analytics
- Behavioral Sentiment & Sentiment Metrics: Alternative.me Crypto Fear & Greed Index
Educational Disclaimer
This guide is prepared strictly for educational, research, and informational purposes and does not constitute personalized financial, investment, legal, or tax advisory services. Cryptocurrency market cycles, digital asset derivatives, and exchange-traded products involve extreme price volatility, liquidity fluctuations, and systemic counterparty risks. Historical cyclical performance, past halving multiples, and on-chain valuation metrics do not guarantee future market outcomes. Always perform independent forensic due diligence and consult a licensed fiduciary financial advisor before executing capital allocations to digital assets.

