

Bitcoin spent the session trapped inside a rotational liquidity band, with execution remaining highly balanced around the session Point of Control (POC) while derivatives positioning continues to unwind. The broader intraday tape shows defensive pressure, but lacks aggressive expansion—a classic environment where price continuously revisits value because neither buyers nor sellers are willing to fully commit.
What stands out immediately is the structural relationship between price, open interest, and footprint aggression. At the time of observation, BTCUSDT trades at $65,378.00, sitting almost directly on top of the Session POC at $65,386.00.
In the framework of Auction Market Theory, this precise alignment tells us one thing clearly: the market is actively auctioning fair value. When price repeatedly loops back to the POC, it confirms that market participants are in temporary agreement regarding current valuation.
However, this consensus is fragile. The moment institutional size steps in to defend or attack liquidity outside of this balanced range, this equilibrium will shatter. Until that expansion triggers, the tape remains highly rotational, coiled for the next directional repricing.
Observed Runtime: UTC Live Feed
Market Snapshot Table
| Market Metric | Live Reading |
|---|---|
| Asset Pair | BTCUSDT |
| Current Price | $65,378.00 |
| 24H High | $65,966.40 |
| 24H Low | $64,789.60 |
| Trend Structure | Strong Bearish Expansion (15m) |
| EMA20 Position | Below EMA20 |
| VWAP Position | Below VWAP |
| Relative Volume | Weak Participation |
| Liquidity Regime | Rotational Compression |
Active Structural Conditions
| Execution Signal | Status / Order Flow Psychology |
|---|---|
| Below VWAP | Sellers retain average inventory control |
| Below EMA20 | Short-term momentum remains defensive |
| Weak Participation | Conviction remains absent |
| Negative Funding | Leveraged longs reducing exposure |
| Declining OI | Position closure dominating |
Intraday Boundary Check (At A Glance)
Bitcoin is positioned almost perfectly between the 24-hour extremes. This matters because it reflects balanced inventory.
Boundary Metrics
| Metric | Reading |
|---|---|
| Distance Below 24H High | 588.40 points |
| Distance Above 24H Low | 588.40 points |
| Value Area High (VAH) | $65,516.77 |
| Value Area Low (VAL) | $65,255.23 |
| Session POC | $65,386.00 |
This symmetrical distribution tells us the market is not favoring either extreme.
The VAH at $65,516.77 is acting as upper rotational supply. Meanwhile, the VAL at $65,255.23 remains the lower acceptance shelf. Every time price revisits these zones, we are essentially watching liquidity test whether passive participants still want inventory there.
This is where smart money often does most of its work — not in breakouts, but inside indecision.
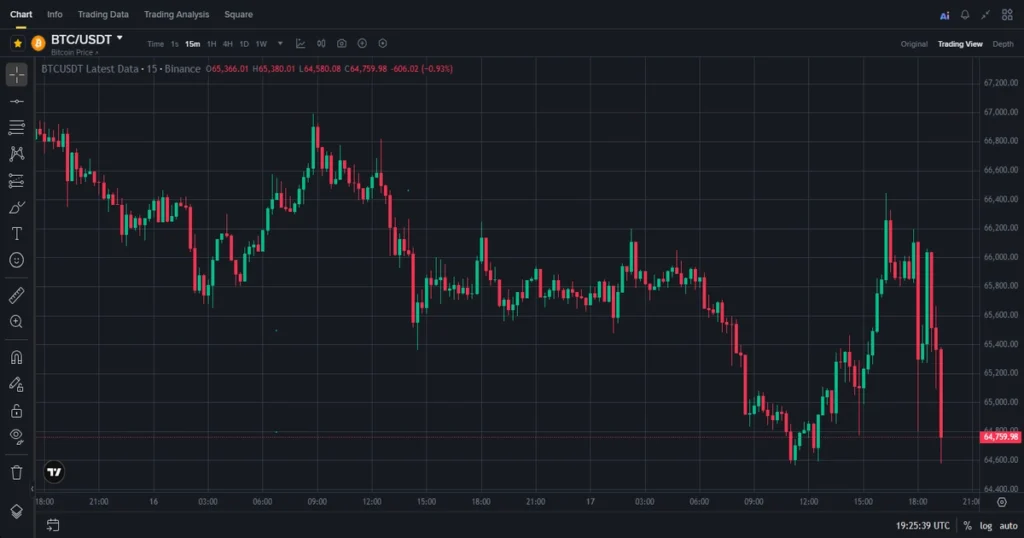
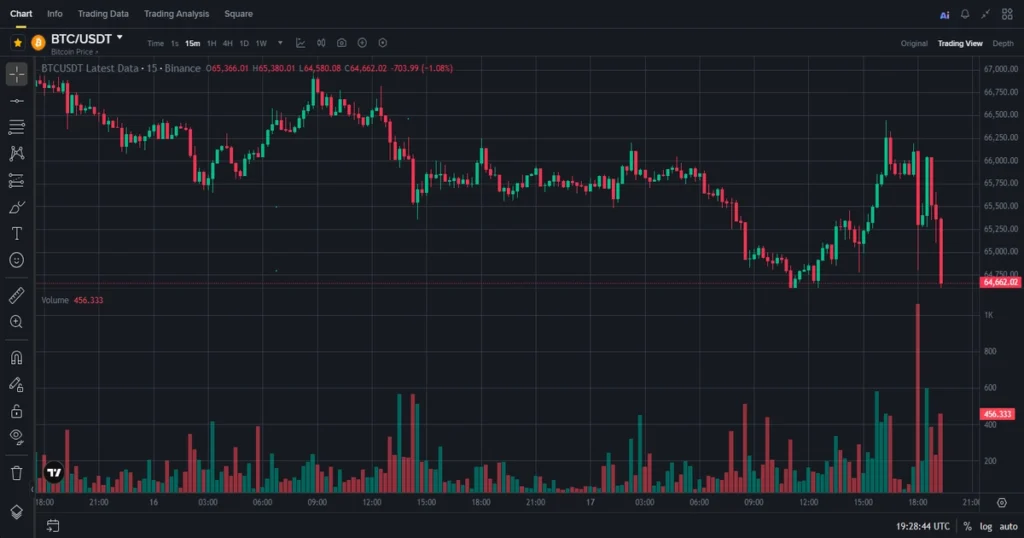
15-Min Live Execution & Trend Breakdown
The order flow layer is where this session becomes interesting.
At surface level, the Live CVD sits at -0.52, which confirms selling pressure remains dominant. But underneath that, there’s evidence of buyers trying to absorb.
Order Flow Dashboard
| Metric | Reading |
|---|---|
| Live CVD | -0.52 |
| Buyer Absorption | +441.62 BTC |
| Seller Aggression | -562.06 BTC |
| Net Footprint Delta | -120.44 BTC |
| OI+CVD Classification | Long Liquidation Escape Flow |
The imbalance is clear.
Buyers absorbed over 441 BTC, but sellers pushed over 562 BTC aggressively into the bid. That creates a negative delta of 120 BTC, meaning offers are still controlling pace.
What matters here is context.
This isn’t fresh short aggression.
The falling open interest confirms that.
That means the selling is more consistent with trapped longs exiting positions rather than new shorts opening heavy size. That distinction matters because liquidation-driven selling behaves differently from trend-driven selling.
Liquidation selling is mechanical.
Trend selling is intentional.
This session looks mechanical.
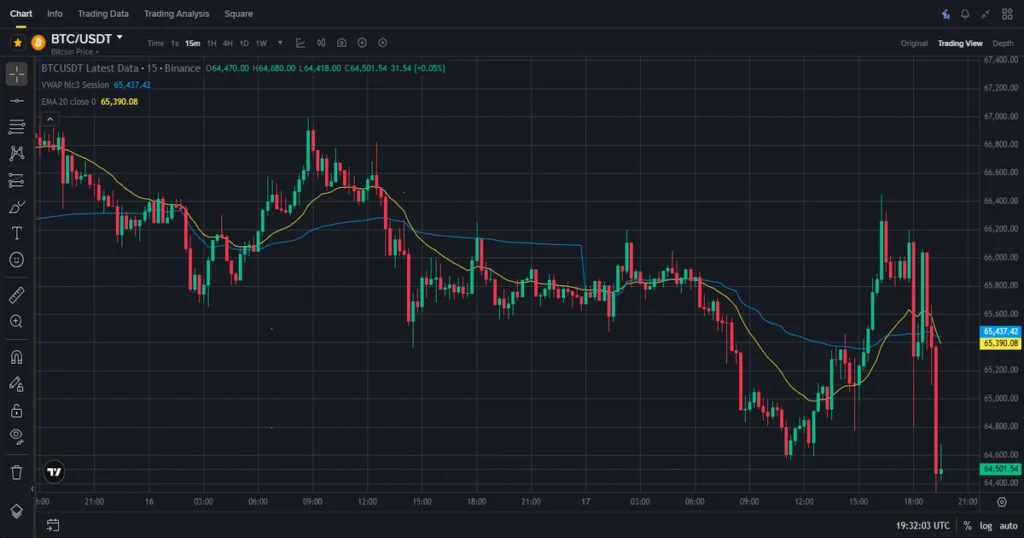
Institutional Gravity — EMA20 & VWAP Interaction
Price is trading below both EMA20 and VWAP.
That immediately shifts control toward sellers.
Structural Positioning
| Baseline | Current Status | Dynamic Market Control |
|---|---|---|
| EMA20 | Below | Momentum remains defensive |
| VWAP | Below | Average buyers underwater |
VWAP acts as the institutional fairness benchmark.
When price stays below VWAP, it tells us the average buyer across the session is holding loss. This creates psychological pressure because every small rally becomes an opportunity to exit break-even.
That behavior creates passive supply.
The 20 EMA confirms that short-term momentum is aligned with this defensive positioning.
Price under both baselines creates layered resistance.
It’s not just technical.
It’s psychological inventory pressure.
Derivatives Layer Breakdown
The derivatives side shows leverage slowly draining.
That’s visible in both funding and open interest.
Detection Matrix
| Detection Metric | Reading |
|---|---|
| Funding Rate | -0.0042% |
| OI 1H Change | -1.15% |
| OI 24H Shift | -4.32% |
| Liquidation Alerts | 0 Blocks Flushed |
| Composite Confidence | 74% Bearish Control |
Negative funding shows long exposure leaving.
But open interest falling by 4.32% over 24 hours confirms broader position reduction.
This is leverage contraction.
Not leverage expansion.
That changes the character of the market.
Markets with expanding open interest usually trend harder.
Markets with falling open interest often rotate and rebalance.
That’s exactly what Bitcoin is doing right now.
Liquidity Concentration Zones
Liquidity Cluster Table
| Liquidity Cluster | Price Level |
|---|---|
| Long Liquidation Zone | $64,789.60 |
| Short Liquidation Zone | $65,966.40 |
| Largest Cluster Concentration | $663,907 |
The market remains boxed between two high-interest liquidation magnets.
That creates gravitational pull.
Liquidity isn’t directional by itself.
It’s attractive.
Price seeks it because that’s where resting orders live.
The larger the cluster, the stronger the magnet.
That’s why current price remains trapped between both extremes.
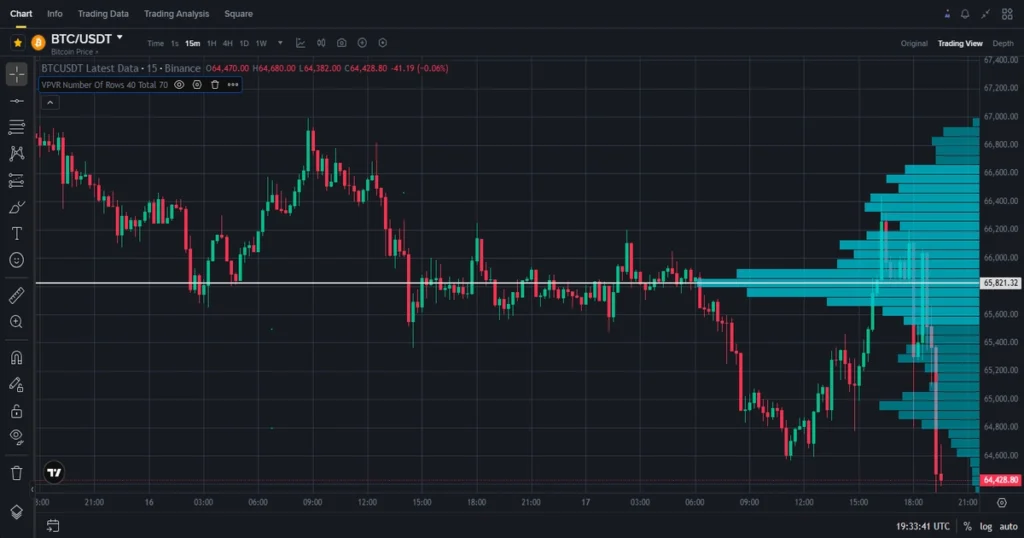
Key Technical Observations
- Session POC remains centered at $65,386.00
- Bollinger Width expanded to 2.35%
- Realized volatility stands at $371.81
- Funding remains negative at -0.0042%
- Open Interest continues draining at -4.32%
- Long/Short ratio remains under 1.00, showing weak bullish positioning
- Seller aggression exceeded buyer absorption by 120.44 BTC
- No major liquidation blocks detected
Execution Psychology Read
This is a classic defensive tape.
Buyers are absorbing, but not reclaiming.
Sellers are pressing, but not expanding.
Open interest is declining, meaning traders are leaving the field.
That’s why price keeps revisiting fair value.
Nobody owns the move yet.
The market is behaving like a compression auction where liquidity matters more than direction.
That’s often where institutional participants quietly rotate inventory.
Not aggressively.
Systematically.
FAQ Section
What does trading below VWAP indicate?
It means average session buyers remain underwater, increasing supply pressure.
Why is declining open interest important?
It shows traders are closing positions rather than adding new leverage.
What does negative funding tell us?
It reflects long-side weakness and leverage reduction.
Why is no BOS significant?
Because structural control hasn’t shifted decisively.
Why is the POC important?
It shows where the highest volume agreement exists.
Technical Conclusion
Bitcoin remains structurally compressed inside a balanced liquidity bracket, with sellers maintaining intraday control through both VWAP and EMA20 positioning. Order flow continues to show long liquidation behavior rather than aggressive fresh short positioning, while open interest contraction confirms broader leverage reduction. Until the market accepts outside value, this remains an inventory rotation session rather than a true directional auction.
What was your best 15-minute setup today?
Financial Disclaimer
This article is for educational and market commentary purposes only. It is not financial advice, investment guidance, or a trading recommendation.

