
Executive Summary & Core Thesis
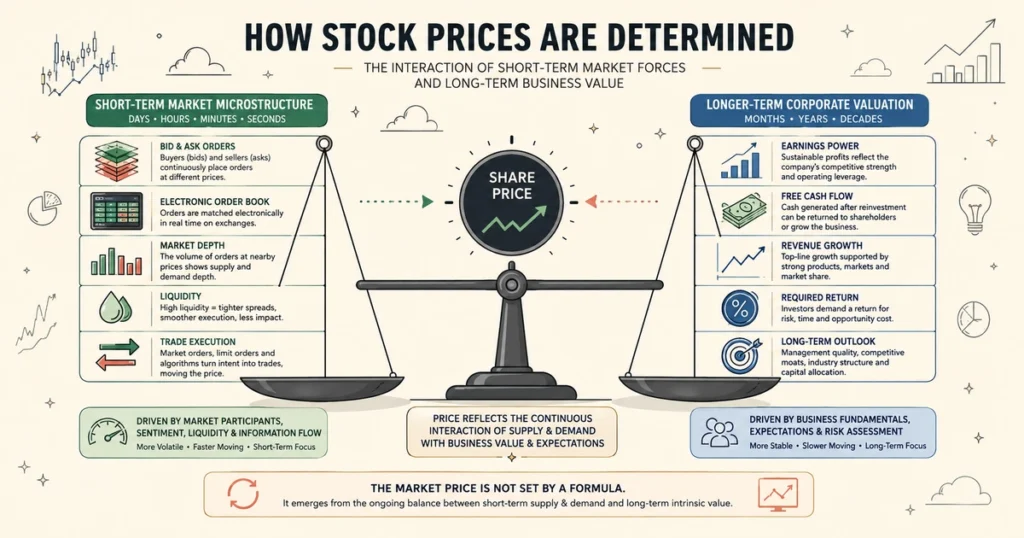
The question of how stock prices are determined spans two distinct financial domains: immediate market microstructure (the mechanical process of trade execution and short-term price formation) and fundamental valuation (the economic forces that anchor prices over multi-year business cycles).
In the immediate term, stock prices are established on electronic exchanges through the continuous interaction of incoming order flow and resting liquidity inside an electronic order book. When aggressive buying volume consumes available sell orders at the ask, prices move upward; when aggressive selling volume clears out resting buy orders at the bid, prices decline.
Over multi-year economic cycles, however, market prices tend to reflect a corporation’s fundamental economic performance—governed by projected future cash flows, earnings growth, discount rates, and macroeconomic liquidity.
The Two Dimensions of Stock Price Determination
To understand how equity prices are set, market analysts divide price determination into two operational horizons: the mechanical short-term horizon and the fundamental long-term horizon.
| Operational Horizon | Primary Driving Mechanism | Core Analytical Focus | Key Market Metrics |
| Short-Term (Milliseconds to Weeks) | Order book microstructure, order flow imbalances, breaking news, and immediate liquidity | Order queue dynamics, market depth, bid-ask spreads, high-frequency execution | Level 2 order book, tick volume, trade imbalance indicators, implied volatility |
| Long-Term (Quarters to Decades) | Corporate earnings power, free cash flow generation, cost of capital, and macroeconomic growth | Return on invested capital (ROIC), competitive moats, discount rates, balance sheet health | Free cash flow yield, EPS growth, P/E multiples, weighted average cost of capital (WACC) |
In the short run, prices fluctuate in response to real-time supply and demand imbalances created by institutional portfolio rebalancing, algorithmic trading strategies, and shifting retail sentiment. Over multi-year investment horizons, stock prices tend to align with the underlying corporation’s ability to generate cash flow relative to prevailing interest rates.
As legendary value investor Benjamin Graham famously framed the concept: “In the short run, the market is a voting machine, but in the long run, it is a weighing machine.” Short-term price fluctuations reflect immediate liquidity and sentiment, while long-term price trajectories reflect corporate earnings capacity.
The Microstructure Engine: The Continuous Double Auction
Quick Answer: How Prices Form Right Now
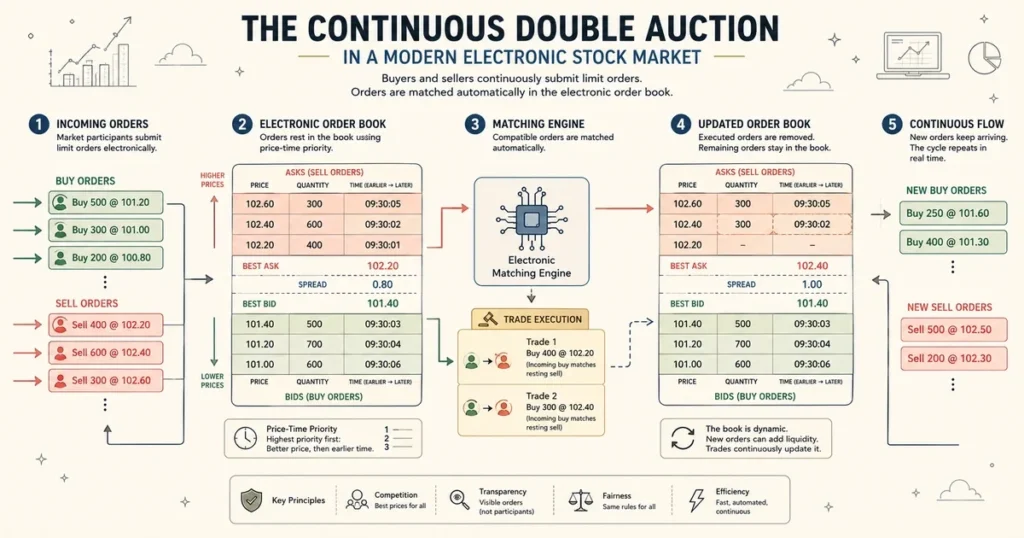
- Mechanism: On many modern electronic exchanges, trading operates through a continuous double-auction mechanism in which multiple buyers and sellers submit competing orders simultaneously.
- Execution: A transaction occurs instantly whenever the highest price a buyer is willing to pay (Bid) matches or exceeds the lowest price a seller is willing to accept (Ask).
- Price Direction: Persistent buying that consumes resting sell orders at the Ask drives the displayed price upward; persistent selling that consumes resting buy orders at the Bid drives the displayed price downward.
Unlike traditional retail markets where a single merchant sets a fixed price for all customers, public stock markets operate as double auctions. In a double auction, both prospective buyers and prospective sellers submit competing price quotes simultaneously.
On modern exchanges, this matching process occurs in fractions of a second through electronic matching engines. To understand how these venues fit into the broader financial system, explore our detailed guide on what the stock market is, which details the network of exchanges and clearing houses facilitating these trades.
The Mechanics of Continuous Matching
In a continuous double auction, incoming orders are processed in real time according to two common matching priorities:
- Price Priority: Orders offering the best prices are executed first. A buyer willing to pay
$100.05takes priority over a buyer willing to pay$100.00. Similarly, a seller willing to accept$100.10takes priority over a seller demanding$100.15. - Time Priority (FIFO – First In, First Out): If multiple participants place orders at the exact same price level, the order that arrived earliest in the matching engine is executed first.
Whenever an aggressive order arrives that crosses the bid-ask boundary, the matching engine pairs the orders, generates an execution report, and updates the public tape with the newly established last traded price.
Order Book Anatomy: Bids, Asks, Spreads, and Depth
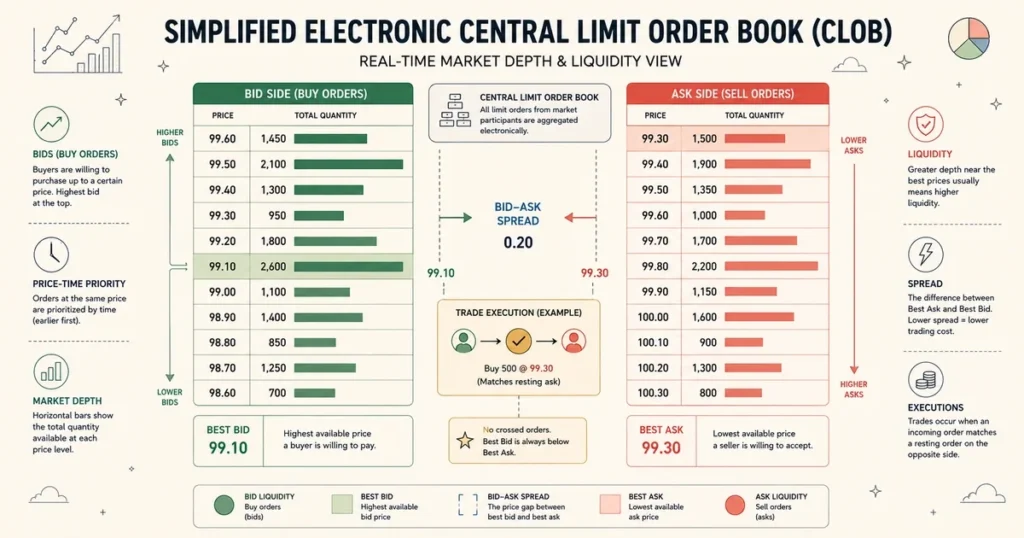
On many modern electronic exchanges, a Central Limit Order Book (CLOB) records resting buy and sell orders at different price levels during trading. The exact market structure and order-matching rules vary by venue and security.
                      ┌─────────────────────────────────────────┐
                      │       ELECTRONIC ORDER BOOK (CLOB)      │
                      └────────────────────┬────────────────────┘
                                           │
         ┌─────────────────────────────────┴─────────────────────────────────┐
         │                                                                   │
         ▼                                                                   ▼
┌──────────────────┐               ┌──────────────────────────────────┐
│         THE BID QUEUE            │               │         THE ASK QUEUE            │
│  (Buyers waiting in price order) │               │  (Sellers waiting in price order)│
├──────────────────┤               ├──────────────────────────────────┤
│ 200 shares @ $149.98             │               │ 300 shares @ $150.02             │
│ 600 shares @ $149.95             │               │ 500 shares @ $150.05             │
│ 1,500 shares @ $149.90           │               │ 1,000 shares @ $150.10           │
└──────────────────┘               └──────────────────────────────────┘
                                   │               │
                                   └───────┬───────┘
                                           │
                                    [BID-ASK SPREAD]
                                   ($150.02 - $149.98 = $0.04)
| Order Book Component | Operational Definition | Role in Price Formation | Impact on Liquidity |
| Bid Price | The highest displayed price a buyer is currently willing to pay | Best available reference for an immediate sell order | Sets the immediate floor for market sell orders |
| Ask (Offer) Price | The lowest displayed price a seller is currently willing to accept | Best available reference for an immediate buy order | Sets the immediate ceiling for market buy orders |
| Bid-Ask Spread | Mathematical difference between lowest Ask and highest Bid | Measures the friction cost of executing an immediate trade | Narrow spreads indicate high liquidity; wide spreads indicate illiquidity |
| Market Depth (Level 2) | The cumulative volume of shares queued across multiple price levels | Governs how much trading volume is required to move the price | Deep order books resist price volatility; thin books experience price slippage |
If a stock possesses deep liquidity (e.g., hundreds of thousands of shares queued across narrow price increments), large transactions can execute with minimal price impact. In illiquid stocks, a modest order can sweep through multiple price tiers, causing rapid price adjustments.
Order Types and Their Direct Impact on Price Formation
The specific order type an investor submits dictates whether that order provides liquidity to the market or consumes liquidity from the order book.
1. Market Orders (Consuming Liquidity)
A market order instructs the broker to seek immediate execution at the best available prices in the market, subject to available liquidity. Market orders prioritize execution speed over price certainty:
- An incoming market buy order matches immediately against the lowest resting Ask.
- An incoming market sell order matches immediately against the highest resting Bid.
- When aggressive market orders rapidly deplete the available share volume at the top of the book, the displayed market price moves to the next available tier in the queue.
2. Limit Orders (Providing Liquidity)
A limit order gives specific price boundaries for trade execution, prioritizing price control over immediate execution:
- A limit buy order specifies the maximum price the buyer is willing to pay.
- A limit sell order specifies the minimum price the seller is willing to accept.
- If a limit order is immediately executable against available counter-orders (e.g., a limit buy placed at or above the current Ask), it executes at once. Otherwise, it rests in the order book, adding depth and providing liquidity for other market participants.
3. Stop Orders and Conditional Triggers
A stop order (or stop-loss order) remains dormant until a specific price threshold is reached:
- Stop-Loss Sell: Placed below the current market price to limit downside exposure. If the market reaches the trigger price, the order becomes an active sell order; if it becomes a market order, it can execute against available bids and may contribute to downward price pressure.
- Cascading Liquidations: In fast-moving sell-offs, a cluster of stop-loss orders triggered simultaneously can flood the order book with market sell orders, rapidly clearing resting Bids and causing sudden downward price cascades.
Market Liquidity, Slippage, and Price Impact Mechanics
The price impact of a trade depends heavily on the order’s size relative to available market depth and liquidity conditions.
                      ┌─────────────────────────────────────────┐
                      │        LARGE INSTITUTIONAL BUY ORDER    │
                      │          (e.g., 50,000 Shares)          │
                      └────────────────────┬────────────────────┘
                                           │
                         (Sweeps Through Order Book Layers)
                                           ▼
                      ┌─────────────────────────────────────────┐
                      │ 10,000 shares executed @ $100.00 (Ask 1)│
                      │ 15,000 shares executed @ $100.05 (Ask 2)│
                      │ 25,000 shares executed @ $100.12 (Ask 3)│
                      └────────────────────┬────────────────────┘
                                           │
                           (Volume-Weighted Average Price)
                                           ▼
                      ┌─────────────────────────────────────────┐
                      │    EFFECTIVE EXECUTION PRICE = $100.075 │
                      │   (New Displayed Market Price = $100.12)│
                      └─────────────────────────────────────────┘
Understanding Slippage and Price Impact
- Slippage: The difference between the expected execution price of an order and the actual volume-weighted price at which the order executes across multiple order book tiers.
- Price Impact: The permanent or semi-permanent change in the displayed market price resulting from the execution of a large order.
- Execution Algorithms: To avoid moving market prices against themselves, institutional asset managers rarely submit large market orders. Instead, they utilize execution algorithms—such as VWAP (Volume-Weighted Average Price) and TWAP (Time-Weighted Average Price)—which slice massive block orders into thousands of micro-orders distributed over hours or trading days.
The Role of Market Makers and High-Frequency Algorithms
Modern electronic markets often rely on institutional liquidity providers, including market makers, to support two-sided quoting and facilitate orderly trading:
| Entity Type | Operational Strategy | Contribution to Price Determination | Revenue Source |
| Designated Market Makers (DMMs) | Obligated by exchange rules to maintain continuous two-sided quotes | Dampens excessive volatility; maintains orderly market spreads | Captures the Bid-Ask spread and exchange liquidity rebates |
| High-Frequency Trading (HFT) Firms | Utilizes algorithmic colocation to trade price discrepancies in microseconds | Updates quotes instantly across venues; tightens spreads | High-volume micro-arbitrage and order flow intermediation |
| Retail & Institutional Flow | Submits fundamental and portfolio-driven investment orders | Represents ultimate economic supply and demand direction | Long-term capital gains and dividend yields |
Market makers do not bet on the long-term directional movement of a stock. Instead, they continually post buy orders at the Bid and sell orders at the Ask, capturing the spread while managing inventory risk. When market uncertainty surges, market makers widen their spreads to compensate for heightened risk, making trading more expensive across the market.
Fundamental Valuation: What Anchors Stock Prices Over the Long Term?
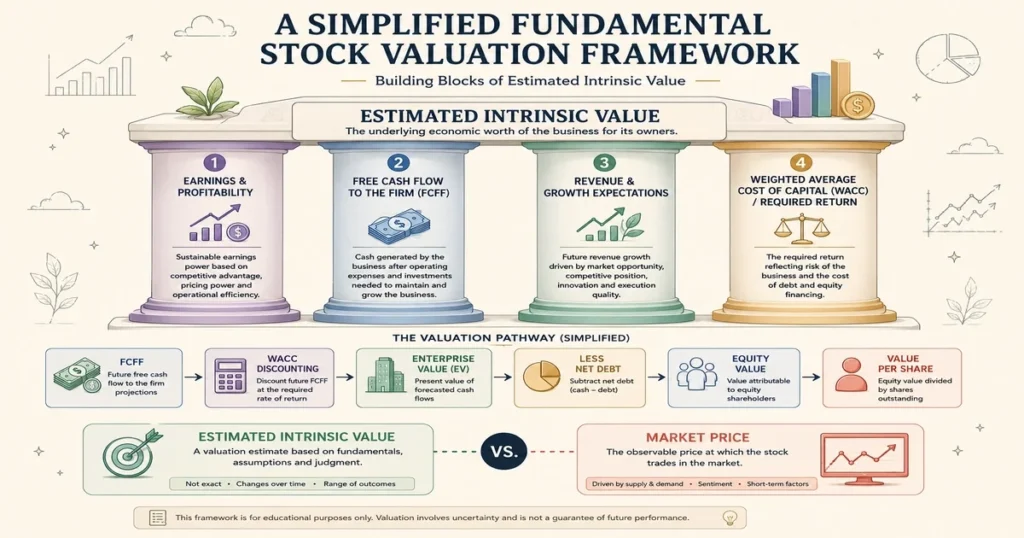
While order books handle second-by-second trade execution, long-term investors determine their bid and ask levels based on fundamental corporate valuation. As established in our foundational guide on what stocks are, each share represents fractional equity co-ownership in an operating business.
Free cash flow represents cash generated by the business after operating requirements and necessary capital investment. Depending on the valuation framework, analysts may calculate Free Cash Flow to the Firm (FCFF) for all capital providers or Free Cash Flow to Equity (FCFE) for equity holders.
                      ┌─────────────────────────────────────────┐
                      │        GROSS CORPORATE REVENUES         │
                      └────────────────────┬────────────────────┘
                                           │
                         (Minus Operating Expenses & Taxes)
                                           ▼
                      ┌─────────────────────────────────────────┐
                      │   OPERATING PROFIT AFTER TAX (NOPAT)    │
                      └────────────────────┬────────────────────┘
                                           │
                         (Minus Net Capital Expenditures & CapEx)
                                           ▼
                      ┌─────────────────────────────────────────┐
                      │    FREE CASH FLOW TO THE FIRM (FCFF)    │
                      │  (The core economic engine of valuation)│
                      └────────────────────┬────────────────────┘
                                           │
                        (Discounted by Cost of Capital - WACC)
                                           ▼
                      ┌─────────────────────────────────────────┐
                      │         TOTAL ENTERPRISE VALUE          │
                      │       (Minus Net Debt Obligations)      │
                      └────────────────────┬────────────────────┘
                                           │
                                           ▼
                      ┌─────────────────────────────────────────┐
                      │    INTRINSIC VALUE PER EQUITY SHARE     │
                      └─────────────────────────────────────────┘
When corporate earnings capacity expands, long-term investors raise the prices they are willing to pay, lifting the entire order book structure over time.
Absolute Valuation Modeling: Discounted Cash Flow (DCF) Mechanics
The primary theoretical framework used by institutional analysts to establish long-term stock value is the Discounted Cash Flow (DCF) model.
A DCF model estimates intrinsic value by calculating the present value of expected future cash flows, adjusted for the time value of money and investment risk:
$$\text{Estimated Enterprise Value} = \sum_{t=1}^{n} \frac{\text{FCFF}_t}{(1 + \text{WACC})^t} + \frac{\text{Terminal Value}}{(1 + \text{WACC})^n}$$
$$\text{Intrinsic Value Per Share} = \frac{\text{Enterprise Value} – \text{Net Debt}}{\text{Shares Outstanding}}$$
Deconstructing the Valuation Variables:
- $\text{FCFF}_t$ (Free Cash Flow to the Firm): The projected operational cash generated by the business in year $t$ available to all capital providers.
- $\text{WACC}$ (Weighted Average Cost of Capital): The blended hurdle rate reflecting the cost of corporate debt and equity.
- $\text{Terminal Value}$: The estimated economic value of all corporate cash flows beyond the explicit multi-year forecast horizon, often calculated using the Gordon Growth Model:
$$\text{Terminal Value} = \frac{\text{FCFF}_{n+1}}{\text{WACC} – g}$$
Where $g$ represents the sustainable long-term perpetual growth rate of the business.
All else equal, higher projected cash flows or a lower discount rate can increase a DCF-based intrinsic-value estimate and may influence investors’ willingness to pay higher prices in the open market.
Relative Valuation Frameworks: Multiples and Peer Comparisons
Because detailed DCF models rely on numerous long-term assumptions, financial markets frequently utilize relative valuation metrics to compare market prices across industry peers:
| Valuation & Income Metric | Mathematical Formula | Analytical Objective | Practical Interpretation |
| Price-to-Earnings (P/E) | $\frac{\text{Share Price}}{\text{Earnings Per Share (EPS)}}$ | Gauges how much investors pay per dollar of current annual net profit | High P/E indicates high future growth expectations; low P/E indicates mature or distressed profile |
| Price-to-Book (P/B) | $\frac{\text{Share Price}}{\text{Book Value Per Share}}$ | Compares market capitalization to net accounting balance sheet asset worth | Commonly used for capital-intensive firms, commercial banks, and industrial companies |
| Enterprise Value to EBITDA (EV/EBITDA) | $\frac{\text{Enterprise Value}}{\text{Operating EBITDA}}$ | Evaluates total operating business valuation independent of capital structure and debt load | Standard metric for mergers, acquisitions, and cross-border corporate valuation |
| Price-to-Sales (P/S) | $\frac{\text{Market Capitalization}}{\text{Total Annual Revenue}}$ | Measures valuation relative to total revenue generation | Useful for early-stage high-growth firms that have not yet achieved steady net profitability |
| Dividend Yield | $\frac{\text{Annual Dividend Per Share}}{\text{Current Share Price}} \times 100$ | Measures direct cash return generated relative to share purchase price | Key metric for income investors and defensive utility/staple equity analysis |
Relative valuation allows market participants to quickly identify whether an individual stock is trading at a premium or discount compared to its industry sector and historical baseline.
Corporate Earnings and Financial Disclosures as Price Catalysts
Stock prices adjust rapidly whenever new, material information changes consensus expectations regarding a company’s future cash flows.
                    ┌───────────────────────────────────────┐
                    │   CONSENSUS MARKET EXPECTATION (EST)  │
                    └───────────────────┬───────────────────┘
                                        │
                         Quarterly Earnings Release
                                        │
                    ┌───────────────────┴───────────────────┐
                    │                                       │
                    ▼                                       ▼
        ┌───────────────────────────┐          ┌───────────────────────────┐
        │   RESULTS EXCEED ESTIMATE │          │    RESULTS MISS ESTIMATE  │
        │  Positive Earnings       │          │  Negative Earnings       │
        │  Surprise                │          │  Surprise                 │
        ├───────────────────────────┤          ├───────────────────────────┤
        │ • Forecasts may rise      │          │ • Forecasts may fall      │
        │ • Buyers may bid more     │          │ • Sellers may act more    │
        │   aggressively            │          │   aggressively             │
        │ • Price may rise          │          │ • Sell orders may consume │
        │                           │          │   available bids           │
        │                           │          │ • Price may decline        │
        └───────────────────────────┘          └───────────────────────────┘
Key Corporate Price Catalysts
- Quarterly Earnings Reports (10-Q / 10-K): Earnings reports provide updated financial data on revenues, operating margins, net income, and capital expenditures.
- Forward Management Guidance: Markets are forward-looking. A company may report strong quarterly earnings, but if executive management lowers its forward revenue guidance for upcoming quarters, the stock price will often fall sharply as valuation models are revised downward.
- Mergers, Acquisitions, and Divestitures: When an acquiring corporation announces an offer to buy a target company at a premium to its prevailing market price, the target company’s share price immediately jumps toward the buyout offer price.
- Regulatory & Clinical Milestones: For specialized sectors (such as biotechnology or energy), regulatory decisions—such as FDA pharmaceutical approvals or energy exploration permits—can dramatically alter future cash flow potential overnight.
Macroeconomic Transmission: How Systemic Forces Move Stock Prices
Individual stocks do not operate in a vacuum; broader macroeconomic conditions alter discount rates, consumer spending, and corporate financing costs across the entire economy:
1. Central Bank Interest Rate Policy
When central banks adjust benchmark interest rates, risk-free yields across sovereign debt markets change:
- Rising Interest Rates: Elevate corporate debt borrowing costs, reduce consumer discretionary spending, and increase the discount rate applied in DCF models. Higher discount rates mathematically compress equity valuation multiples, placing downward valuation pressure on equities (particularly high-growth technology shares). The broader link between interest rates and exchange rates further modulates these valuation dynamics for multinational companies.
- Falling Interest Rates: Lower corporate debt servicing expenses and reduce yields on fixed-income investments, encouraging institutional capital to rotate toward equities in search of higher returns.
2. Gross Domestic Product (GDP) and Economic Cycles
- Economic Expansions: Accelerating GDP growth boosts corporate sales volume, capacity utilization, and business capital expenditures, supporting earnings expansion across listed companies.
- Economic Contractions (Recessions): Declining consumer demand and rising default rates compress operating profit margins, prompting investors to reduce valuation estimates.
3. Inflation and Input Cost Structures
- Moderate, Predictable Inflation: Allows businesses with competitive pricing power to raise consumer prices in tandem with input costs, preserving profit margins.
- Cost-Push Inflation Shocks: Surging expenses in raw materials, logistics, and labor compress corporate profit margins for companies that lack pricing power, leading to downward earnings revisions.
Market Efficiency vs. Behavioral Sentiment Cycles
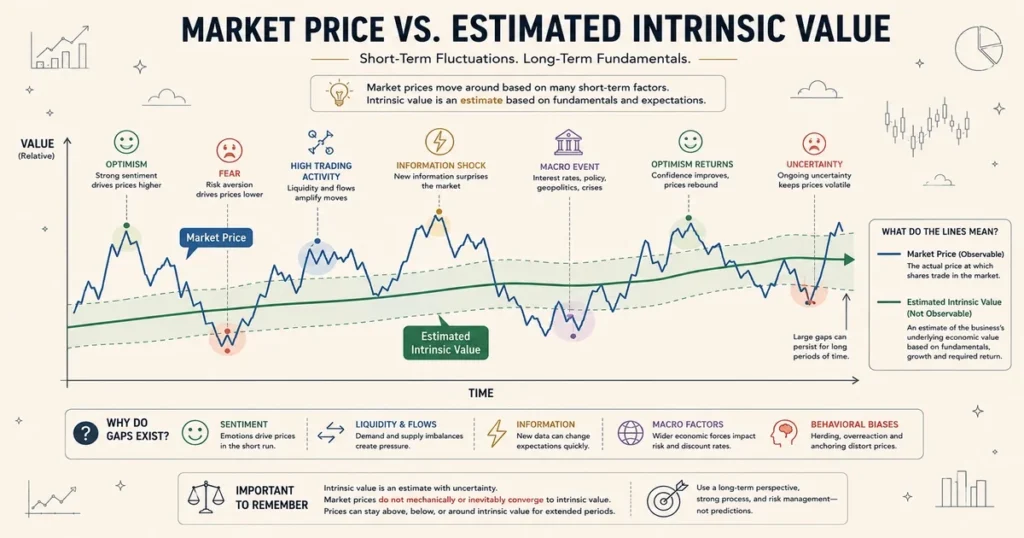
Financial economists study how effectively market prices reflect underlying economic reality through two complementary schools of thought:
| Analytical School | Core Theoretical Premise | Implication for Stock Price Determination |
| Efficient Market Hypothesis (EMH) | Market prices incorporate available financial information to varying degrees depending on market structure | Consistently achieving abnormal risk-adjusted returns through public data alone is difficult |
| Behavioral Finance Theory | Psychological biases, cognitive errors, and market frictions influence investor decisions | Stock prices frequently deviate from fundamental intrinsic value estimates over the short term |
Stock prices can deviate materially from estimated fundamental value as sentiment, liquidity, information shocks, and market constraints change:
                      ┌─────────────────────────────────────────┐
                      │        INTRINSIC CORPORATE VALUE        │
                      │  (Steady multi-year business growth)    │
                      └────────────────────┬────────────────────┘
                                           │
         ┌─────────────────────────────────┴─────────────────────────────────┐
         │                                                                   │
         ▼                                                                   ▼
┌──────────────────┐               ┌──────────────────────────────────┐
│      GREED & SPECULATIVE BUBBLE  │               │       FEAR & PANIC LIQUIDATION   │
│ (Prices trade far above intrinsic│               │ (Prices trade far below intrinsic│
│  value due to momentum mania)    │               │  value due to forced selling)    │
└──────────────────┘               └──────────────────────────────────┘
- Herd Behavior and Momentum: During speculative bull markets, investors often buy shares simply because prices are rising, driving valuations well above fundamental cash flow reality.
- Forced Liquidations and Margin Calls: During market panics, institutional margin calls, fund redemption pressures, and algorithmic stop-loss triggers can force large-scale liquidations, driving stock prices significantly below their fair intrinsic values.
Corporate Structural Actions and Share Supply Dynamics
A stock’s price is also directly influenced by changes in the total supply of shares outstanding:
1. Share Repurchases (Stock Buybacks)
When a corporation utilizes cash reserves to buy back its own shares from the open market, those shares are retired or absorbed into corporate treasury.
- If net income remains unchanged, reducing the total share count mechanically increases Earnings Per Share (EPS) ($\text{EPS} = \frac{\text{Net Income}}{\text{Shares Outstanding}}$).
- This mechanical increase in EPS can support valuation, although the market-price effect also depends on the price paid for the repurchased shares, financing, investor expectations, and other fundamentals.
2. Secondary Share Offerings and Dilution
When a public corporation issues additional new shares to raise expansion capital, the total number of shares outstanding increases.
- Existing shareholders now own a smaller fractional percentage of the overall company (equity dilution).
- Because corporate earnings are now divided across a larger number of shares, EPS temporarily declines, which often places downward pressure on the per-share market price.
3. Stock Splits and Reverse Splits
- Forward Stock Split (e.g., 2-for-1): Doubles the number of shares outstanding while halving the nominal price per share. The company’s total market capitalization remains unchanged, but the lower share price improves retail trading accessibility.
- Reverse Stock Split (e.g., 1-for-10): Consolidates multiple shares into one higher-priced share, often executed to maintain exchange listing compliance without altering total business value.
Frequently Asked Questions (Institutional FAQ)
What is the most basic factor that determines a stock price?
At the most direct operational level, the displayed stock price changes when incoming buy and sell orders interact with available liquidity in the order book. Aggressive buying can consume offers and move the price upward, while aggressive selling can consume bids and move it downward.
Why do stock prices change every few seconds during market hours?
Stock prices change continuously because new market orders and limit orders enter the electronic order book in real time. Institutional asset managers, algorithmic market makers, and retail investors constantly update their bids and offers in response to incoming financial data, trade executions, and shifting liquidity.
What is the difference between a stock’s market price and its intrinsic value?
A stock’s market price is the current price at which shares trade on a public exchange based on immediate supply, demand, and liquidity. Its intrinsic value is the estimated fundamental worth of the business based on the discounted present value of its expected future cash flows and underlying assets.
How do company earnings reports affect stock prices?
Earnings reports provide updated information regarding revenue, operating margins, net income, and forward growth guidance. When performance exceeds market expectations, buying demand generally drives prices higher; when results or forecasts disappoint, selling pressure tends to push prices down.
Can a single large trade move a stock’s price?
Yes. If an investor submits a large market order that exceeds the available share volume at the best bid or ask, the order sweeps through multiple price tiers in the order book, moving the displayed market price.
Strategic Summary & Institutional Takeaways
Understanding how stock prices are determined requires analyzing both market microstructure and fundamental economic valuation.
In the short term, stock prices are established through continuous double auctions on electronic exchanges, where the interaction of market orders and limit orders determines the prevailing market price inside the central limit order book.
Over multi-year horizons, stock prices are increasingly influenced by the underlying business’s earnings power, cash-flow generation, growth prospects, and required return. By evaluating earnings trajectories, discounting future cash flows, and monitoring macroeconomic rate environments, investors and financial analysts can assess whether a prevailing market price represents a reasonable reflection of corporate earning power.
Next Reading Suggestions
- What Is the Stock Market? How Global Equity Markets Work and Allocate Capital
- What Are Stocks? The Complete Guide to Shares, Equity, and Ownership
- Stock Market History: The Evolution of Global Equity Markets and Capital Systems
- Interest Rates and Exchange Rates: The Macroeconomic Transmission Mechanism
Author Box & E-E-A-T Verification
Written By: CurrencyPlans Financial Research Team
Fact-Checked & Reviewed By: Financial Research Team & Equity Editorial Board
Editorial Integrity & Research Standards: CurrencyPlans publishes institutional-grade research grounded in verified corporate finance principles, academic financial economics, and regulatory market disclosures. All market microstructure concepts, order-matching frameworks, and valuation models are cross-referenced with primary multilateral institutions and securities regulatory bodies, including the US Securities and Exchange Commission (SEC), the Financial Industry Regulatory Authority (FINRA), and the World Federation of Exchanges (WFE).
Primary Institutional References & Regulatory Resources
For primary regulatory guidelines, market architecture standards, and global securities data, consult official institutional sources directly:
- Global Exchange Statistics & Architecture Data: World Federation of Exchanges (WFE)
- Investor Education & Market Microstructure Regulations: US Securities and Exchange Commission (SEC)
- Order Execution & Market Making Rules: Financial Industry Regulatory Authority (FINRA)
- International Financial Stability & Capital Market Research: Bank for International Settlements (BIS)
- International Financial Statistics & Economic Data: International Monetary Fund (IMF) Data Portal
Educational Disclaimer
This guide is prepared strictly for educational, informational, and research purposes and does not constitute financial, investment, legal, or tax advice. Equities and capital market instruments carry inherent risk of capital loss, price volatility, and business failure. Past performance does not guarantee future results. Always perform independent due diligence and consult a licensed financial advisor before making investment commitments.

