
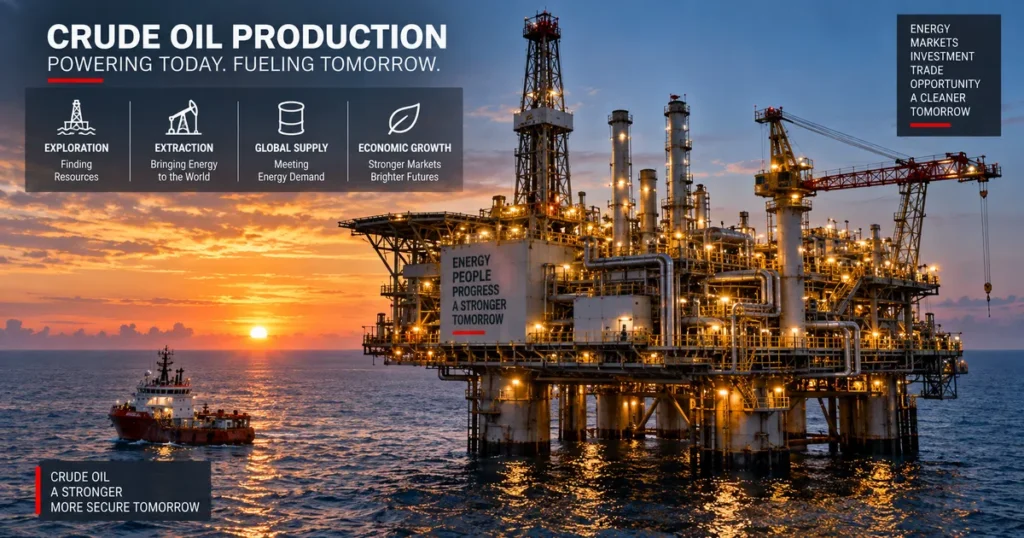
In global macroeconomics, international trade, and capital markets, crude oil is one of the world’s most heavily traded physical commodities and a central input to global transportation, heavy manufacturing, and petrochemical synthesis. Extracted from ancient subsurface geological deposits, this unrefined liquid hydrocarbon mixture provides the base feedstocks for automotive gasoline, ultra-low sulfur diesel (ULSD), commercial aviation jet fuel, marine bunker oils, and industrial polymers.
Unlike manufactured goods or digital assets, crude oil operates under the strict disciplines of subterranean geology, multi-billion-dollar capital expenditure horizons, complex maritime transit chokepoints, and high short-term price inelasticity. Production adjustments by the Organization of the Petroleum Exporting Countries (OPEC) and participating non-OPEC allies, an unscheduled refinery shutdown along the US Gulf Coast, or an unexpected geopolitical disruption along key transit straits can immediately reshape pricing across electronic futures exchanges.
Crude oil price discovery occurs across interconnected financial exchanges—principally the Chicago Mercantile Exchange (NYMEX/CME Group) and the Intercontinental Exchange (ICE)—alongside extensive physical spot cargo markets assessed by Price Reporting Agencies (PRAs). Because liquid energy feedstocks sit at the foundation of transportation and industrial logistics, movements in crude prices can influence corporate transport costs, sovereign trade balances, inflation, and monetary-policy considerations, functioning as the primary pillar of hard commodities detailed in our comprehensive guide on commodity prices.
Executive Summary: What Is Crude Oil?
Quick Answer: What Is Crude Oil?
Crude oil is a naturally occurring, unrefined mixture composed predominantly of hydrocarbons and organic compounds found in geological formations beneath the Earth’s surface. It is formed over millions of years from the heat and pressure transformation of prehistoric marine biomass (zooplankton and algae). Classified as a non-renewable fossil fuel, raw petroleum must be extracted via surface drilling or deepwater offshore wells and refined through fractional distillation to produce usable commercial fuels, lubricants, and chemical feedstocks.
To understand crude oil within the broader energy architecture, consider its structural path from subterranean rock to final energy consumption:
                         ┌──────────────────────────────────────────────┐
                         │         THE CRUDE OIL ENERGY PIPELINE        │
                         └──────────────────────┬───────────────────────┘
                                                │
        ┌───────────────────────────────────────┴───────────────────────────────────────┐
        │                                                                               │
        ▼                                                                               ▼
┌────────────────────────────────────────┐                     ┌────────────────────────────────────────┐
│ UPSTREAM: EXTRACTION & GEOLOGY         │                     │ DOWNSTREAM: REFINING & PRODUCTS        │
├────────────────────────────────────────┤                     ├────────────────────────────────────────┤
│ * Conventional Onshore & Offshore      │  ── Transport ──►   │ * Fractional Distillation (Boiling Pt) │
│ * Unconventional Tight Shale (Fracking)│     (Pipelines &    │ * Catalytic Cracking & Hydrotreating   │
│ * Heavy Oil & Oil Sands / Bitumen      │      Tanker Ships)  │ * Transportation Fuels (Gas/Diesel/Jet)│
│   Extraction                            │                     │ * Petrochemicals (Naphtha, Plastics)   │
│ * Chemical Makeup: Hydrocarbons,       │                     │                                        │
│   Sulfur & Other Compounds              │                     │                                        │
└───────────────────┬────────────────────┘                     └───────────────────┬────────────────────┘
                    │                                                              │
                    └──────────────────────────────┬───────────────────────────────┘
                                                   │
                                                   ▼
                    ┌─────────────────────────────────────────────────────────────┐
                    │ COMMERCIAL TRADING & BENCHMARKS                             │
                    ├─────────────────────────────────────────────────────────────┤
                    │ * West Texas Intermediate (WTI) – Pipeline, Cushing, OK     │
                    │ * Brent Crude / Brent Complex – Seaborne & Index Settlement │
                    │ * Dubai / Oman – Asian Middle East Sour Reference Assays    │
                    │ * Physical Spot Cargoes vs. Exchange-Cleared Futures        │
                    └─────────────────────────────────────────────────────────────┘
The fundamental properties of crude oil include:
- Hydrocarbon Diversity: Crude oil is not a single uniform chemical compound. It is a variable mixture of hydrocarbons ranging from light methane and propane gases dissolved in the liquid to heavy, viscous asphaltenes and bitumen.
- Capital Intensity and Long Lead Times: Conventional deepwater extraction fields or large-scale oil sands projects require multi-year capital planning, seismic imaging, and infrastructure fabrication, meaning global conventional supply cannot instantly scale during demand spikes.
- Universal Macroeconomic Exposure: Because petroleum products fuel the majority of global transport fleets, changes in crude oil prices act as a direct cost shock or dividend to industrial corporate margins, consumer purchasing power, and international trade accounts.
Chemical Composition and Physical Classifications: Sweet, Sour, Light, and Heavy
Quick Answer: How Is Crude Oil Classified?
In commercial markets, crude oil is classified along two primary physical axes: Density, measured by API Gravity (Light vs. Heavy), and Sulfur Content (Sweet vs. Sour). Light sweet crude often commands a pricing premium because many refineries can process it into valuable products like gasoline and diesel with relatively less intensive upgrading and sulfur removal.
The quality of raw crude oil dictates its refinery yield and commercial value:
                      ┌─────────────────────────────────────────┐
                      │    CRUDE OIL QUALITY MATRIX (API / S)   │
                      └────────────────────┬────────────────────┘
                                           │
         ┌─────────────────────────────────┴─────────────────────────────────┐
         │                                                                   │
         ▼                                                                   ▼
┌──────────────────────────────────┐               ┌──────────────────────────────────┐
│ API GRAVITY (DENSITY)            │               │ SULFUR CONTENT (SWEET VS. SOUR)  │
├──────────────────────────────────┤               ├──────────────────────────────────┤
│ * Light Crude: API > 31.1°       │               │ * Sweet Crude: Sulfur < 0.5%     │
│   (Flows easily; high gasoline)  │               │   (Low corrosion; less refining) │
│ * Medium Crude: API 22.3° - 31.1°│               │ * Sour Crude: Sulfur > 0.5%      │
│   (Balanced industrial slate)    │               │   (Corrosive; requires desulfur- │
│ * Heavy Crude: API < 22.3°       │               │    ization hydrotreaters)        │
│   (Dense, viscous; high asphalt) │               │ * Extra Sour: Sulfur > 2.0%      │
└──────────────────┬───────────────┘               └──────────────────┬───────────────┘
                   │                                                  │
                   └────────────────────────┬─────────────────────────┘
                                            │
                                            ▼
                   ┌──────────────────────────────────────────────────┐
                   │ PREFERRED MARKET GRADE: LIGHT SWEET CRUDE        │
                   │ (e.g., WTI: 37°-42° API, <0.42% S / Brent)       │
                   └──────────────────────────────────────────────────┘
1. API Gravity (American Petroleum Institute Density)
API gravity is an inverse measure of the density of petroleum liquid relative to water:
$$\text{API Gravity} = \frac{141.5}{\text{Specific Gravity at } 60^\circ\text{F}} – 131.5$$
- Light Crude (API > 31.1°): Has low density, flows freely at room temperature, and contains a high proportion of light hydrocarbon molecules. It yields high percentages of gasoline, naphtha, and kerosene when distilled.
- Medium Crude (API 22.3° to 31.1°): Offers a balanced distillation profile between light transport fuels and middle distillates.
- Heavy Crude (API < 22.3°): Highly viscous, dense oil (such as Mexican Maya or Venezuelan Orinoco crude) that does not flow easily and requires specialized coking units to crack into transportation fuels.
- Extra Heavy / Bitumen (API < 10.0°): Extremely dense petroleum, including raw oil-sands bitumen, which generally requires dilution or upgrading before pipeline transportation.
2. Sulfur Concentration: Sweet vs. Sour
- Sweet Crude: Petroleum containing less than 0.5% sulfur by weight (including major light-sweet benchmarks such as WTI and Brent). Sweet crude generally requires less intensive sulfur-removal processing than higher-sulfur crude and can reduce the refinery processing burden associated with sulfur removal.
- Sour Crude: Petroleum containing greater than 0.5% sulfur (such as Dubai, Oman, or Arab Heavy). Refining sour crude requires complex, energy-intensive hydrotreating units to strip sulfur atoms, resulting in higher capital processing costs and leading sour grades to trade at a benchmark discount.
Global Crude Oil Benchmarks: WTI, Brent, and Dubai/Oman
Quick Answer: What Is the Difference Between WTI and Brent Crude?
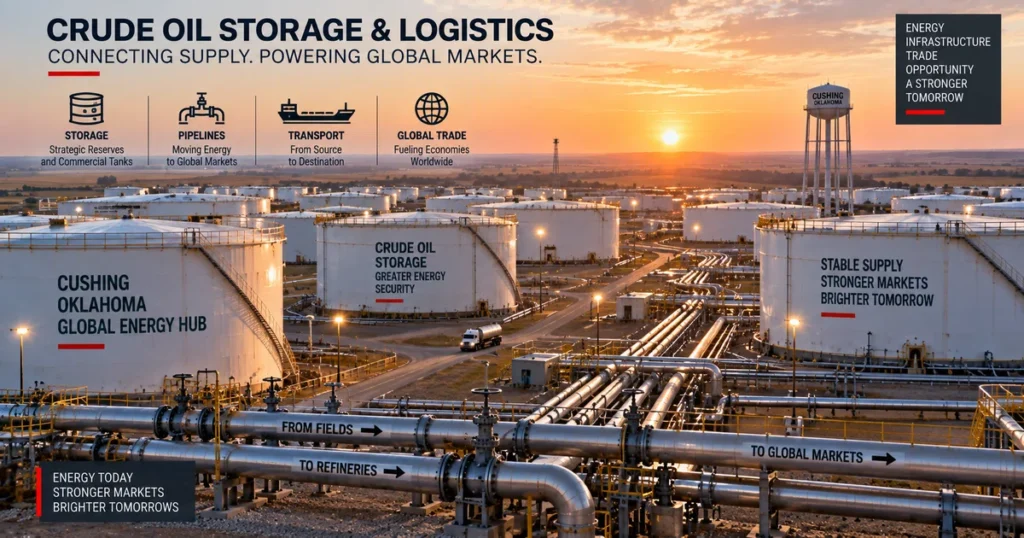
WTI (West Texas Intermediate) is a major North American light, sweet crude benchmark extracted in the United States, traded on the NYMEX, and physically delivered via continental pipelines at Cushing, Oklahoma. Brent Crude is a light, waterborne North Sea benchmark traded on ICE and serves as the leading international reference for globally traded crude oil.
Because thousands of distinct oil fields produce petroleum with varying chemical qualities and geographic delivery terms, international trade relies on standardized benchmark grades:
| Metric / Specification | West Texas Intermediate (WTI) | Brent Crude (Dated Brent / ICE) | Dubai / Oman Crude | Western Canadian Select (WCS) |
|---|---|---|---|---|
| Primary Trading Venue | NYMEX / CME Group (CL) | ICE Futures Europe (B) | Dubai Mercantile Exchange (DME) | Physical OTC / Netback Basis |
| Physical/Settlement Mechanism | Physical Delivery Hub: Cushing, OK | EFP-linked Brent delivery; optional cash settlement against ICE Brent Index | Seaborne Maritime Cargo Loading | Pipeline Delivery Hub: Hardisty, AB |
| API Gravity (Density) | 37° – 42° API (Light) | ~38° API (Light) | ~31° API (Medium) | 20° – 22° API (Heavy) |
| Sulfur Concentration | < 0.42% (Sweet) | ~0.40% (Sweet) | ~2.0% (Sour) | ~3.5% (High Sour) |
| Logistical Dynamic | Landlocked continental pipeline | Waterborne seaborne cargo | Maritime Persian Gulf export | Heavy landlocked rail/pipeline |
| Global Market Role | US domestic & export pricing | Global international reference | Important pricing reference for medium-sour crude in Asia | Heavy refinery discount grade |
+---------------------------------------------------------------------------------------------------+
|                            THE WTI-BRENT CRUDE SPREAD DYNAMICS                                    |
+---------------------+-----------------------------+-----------------------+-----------------------+
| MARKET CONDITION    | ILLUSTRATIVE SPREAD BEHAVIOR| UNDERLYING CAUSE      | ECONOMIC OUTCOME      |
+---------------------+-----------------------------+-----------------------+-----------------------+
| **Cushing Pipeline  | WTI trades at wider discount| US crude trapped inland| US refiners enjoy low |
| Congestion**        | to Brent (market-dependent) | due to pipeline caps  | feedstock input costs |
+---------------------+-----------------------------+-----------------------+-----------------------+
| **US Crude Export   | WTI-Brent spread narrows to | Excess US crude moves | Global markets absorb |
| Parity**            | maritime freight economics  | to Gulf export docks  | US light sweet crude  |
+---------------------+-----------------------------+-----------------------+-----------------------+
| **European Supply   | Brent commands elevated     | North Sea maintenance | European refiners bid |
| Disruption**        | premium over US crudes      | or regional disruption| up seaborne imports   |
+---------------------+-----------------------------+-----------------------+-----------------------+
*Note: Illustrative spread behavior; actual differentials vary with location, quality, freight, and market conditions.
1. West Texas Intermediate (WTI)
Traded on the New York Mercantile Exchange (NYMEX), WTI is a major North American benchmark. Standardized to 1,000 barrels (42,000 US gallons), physical delivery occurs at Cushing, Oklahoma—an interconnected pipeline crossroads featuring expansive above-ground storage capacity. WTI is light and sweet, yielding high fractions of gasoline and diesel.
2. Brent Crude Blend
The Brent complex is a waterborne benchmark built around North Sea crude streams, with WTI Midland incorporated into the Brent pricing basket since 2023. Brent cargo loadings establish international seaborne value, while ICE Brent futures can settle through Exchange of Futures for Physicals (EFP) mechanisms or cash settlement against the ICE Brent Index.
3. Dubai and Oman Crude
Because Asian economies import large volumes of medium sour crude from Persian Gulf producers, Dubai and Oman crudes serve as important pricing references for medium-sour crude traded into Asian markets, reflecting refinery demand across Japanese, South Korean, Indian, and Chinese processing centers.
How Crude Oil Is Refined: Atmospheric Distillation and Crack Spreads
Quick Answer: How Does Oil Refining Work?
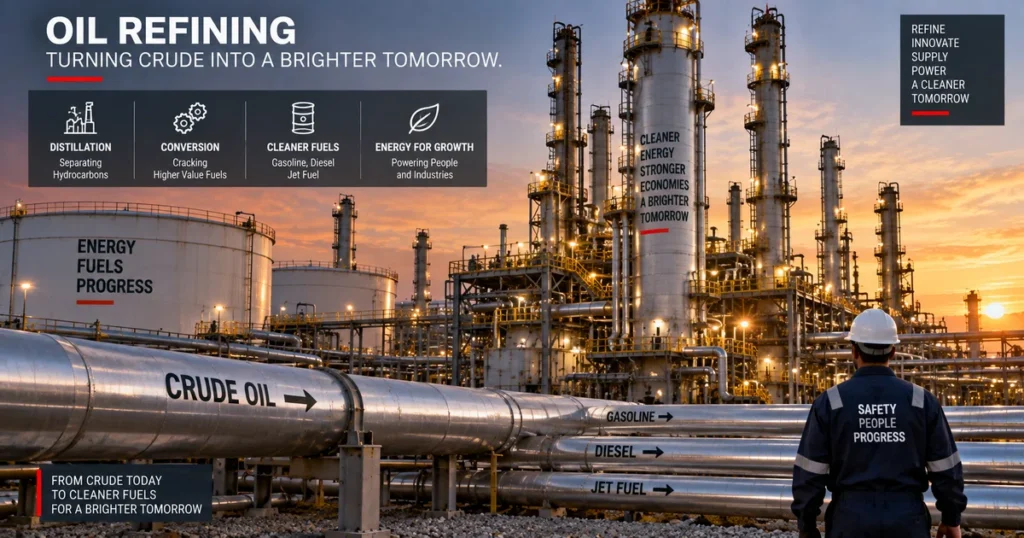
Petroleum refining is the industrial process of converting raw crude oil into finished commercial products. It begins with Atmospheric Fractional Distillation, which heats crude to separate hydrocarbon vapors as they condense at distinct temperature ranges inside a fractionating column. Downstream secondary conversion units—such as catalytic crackers and hydrotreaters—further crack heavy molecules and remove sulfur to achieve finished fuel specifications like gasoline and ultra-low sulfur diesel.
Refineries process crude oil into intermediate cuts and finished fuels:
┌───────────────────────────────────────────────────────────────────────────────────────────────┐
│              APPROXIMATE BOILING RANGES AND ATMOSPHERIC REFINERY FRACTIONS                    │
├───────────────────────────────────────────────────────────────────────────────────────────────┤
│ Atmospheric Gas Cut (Light Ends: < 70°C)   ──► Petroleum Gases (LPG, Propane, Butane)         │
│ Light Distillate Cut (~70°C - 140°C)       ──► Straight-Run Naphtha (Reforming Feedstock)     │
│ Middle Distillate Cut (~140°C - 240°C)      ──► Kerosene Fraction (Hydrotreated to Jet Fuel)   │
│ Heavy Distillate Cut (~240°C - 350°C)       ──► Atmospheric Gas Oil (Treated to ULSD/Diesel)   │
│ Column Residue Fraction (> 350°C)           ──► Heavy Residue (Vacuum Flashed to Asphalt/Coke) │
└───────────────────────────────────────────────────────────────────────────────────────────────┘
*Note: Approximate boiling ranges; actual refinery cut points vary by crude assay, operating parameters, and downstream unit configurations.
1. Secondary Conversion and Upgrading
Simple atmospheric distillation alone does not yield commercial fuels that satisfy modern environmental and engine performance standards:
- Fluid Catalytic Cracking (FCC): Uses high temperatures and zeolite catalysts to break long-chain heavy gas-oil molecules into high-octane gasoline blendstocks.
- Hydrocracking and Hydrotreating: Reacts hydrocarbon streams with hydrogen gas over catalysts under high pressure to remove sulfur, nitrogen, and aromatics, producing clean-burning ultra-low sulfur diesel (ULSD) and aviation jet fuel.
- Delayed Coking: Thermally cracks heavy vacuum residuum into lighter gas oils and petroleum coke (petcoke).
2. The 3:2:1 Crack Spread: Measuring Refinery Profitability
As noted in regulatory research from the U.S. Energy Information Administration (EIA), refiners evaluate and hedge operating margins using product-to-crude price differentials known as crack spreads:
- The Industry Standard 3:2:1 Ratio: Approximates the theoretical margin of an operational refinery processing three barrels of crude oil to produce two barrels of gasoline and one barrel of distillate (diesel/heating oil).
The theoretical gross refining margin per barrel is expressed as:
$$\text{3:2:1 Crack Spread (\$/bbl)} = \frac{(2 \times \text{Price of Gasoline}) + (1 \times \text{Price of Diesel}) – (3 \times \text{Price of Crude Oil})}{3}$$
When consumer fuel demand outstrips operational refining capacity, the crack spread widens, expanding refining margins. When refined fuel inventories accumulate or crude feedstock costs outpace fuel prices, crack spreads compress.
What Determines Crude Oil Prices? Supply, Demand, and Cost Curves
Quick Answer: What Drives Crude Oil Prices?
Crude oil prices are determined by physical supply-demand balances, commercial inventory levels, OPEC+ production adjustments, marginal extraction economics, macroeconomic growth rates, and currency exchange movements (specifically the US Dollar). In the short run, oil demand and supply are relatively price-inelastic, meaning modest disruptions can trigger significant price adjustments.
The fundamental economic drivers operate across physical and financial channels:
                          ┌──────────────────────────────────────────────┐
                          │         CRUDE OIL PRICE DETERMINATION        │
                          └──────────────────────┬───────────────────────┘
                                                 │
         ┌───────────────────────────────────────┴───────────────────────────────────────┐
         │                                                                               │
         ▼                                                                               ▼
┌────────────────────────────────────────┐                     ┌────────────────────────────────────────┐
│ PHYSICAL FUNDAMENTAL DRIVERS           │                     │ MACROECONOMIC & FINANCIAL DRIVERS      │
├────────────────────────────────────────┤                     ├────────────────────────────────────────┤
│ * OPEC+ Production Decisions           │                     │ * US Dollar Valuation Movements        │
│ * Global Upstream Capital Investments  │                     │ * Global Industrial Manufacturing PMIs │
│ * Commercial Inventories (OECD Stocks) │                     │ * Real Interest Rates & Inventory Carry│
│ * Finished Fuel Demand (Mobility/Trade)│                     │ * Financial Speculator Positioning (COT│
└───────────────────┬────────────────────┘                     └───────────────────┬────────────────────┘
                    │                                                              │
                    └──────────────────────────────┬───────────────────────────────┘
                                                   │
                                                   ▼
                    ┌─────────────────────────────────────────────────────────────┐
                    │ SPOT & FORWARD CURVE EQUILIBRIUM (CONTANGO / BACKWARDATION) │
                    └─────────────────────────────────────────────────────────────┘
1. Supply Inelasticity and Marginal Cost Curves
Petroleum extraction cannot instantly adjust to rapid price changes. Conventional offshore projects require multi-year engineering and capital cycles. Similarly, consumer demand is relatively inelastic over short horizons: industrial transport, freight logistics, and commuting patterns cannot instantly substitute away from liquid hydrocarbons.
Market clearing prices gravitate toward the cost of bringing the next needed barrel of production to market:
- Conventional Low-Cost Basins: Onshore fields with low geological extraction costs (such as giant fields in the Middle East).
- Medium-Cost Offshore Basins: Deepwater shelf drilling and complex offshore projects that require significant sustaining capital.
- Marginal Resource Basins: Tight shale plays requiring continuous capital expenditure and drilling, alongside capital-intensive synthetic crude projects.
If market prices remain below operating and sustaining costs for extended periods, upstream capital expenditures decline, drilling rigs are idled, and natural reservoir depletion reduces market supply until balance is restored.
2. The US Dollar Relationship
Because primary global oil benchmarks are cleared and invoiced in US Dollars (USD):
- When the Dollar Weakens: Oil becomes relatively cheaper in local currency terms for consuming nations in Europe and Asia, which can support purchasing power and provide upward support for dollar-denominated oil prices.
- When the Dollar Strengthens: All else equal, importing crude oil becomes more expensive for non-dollar economies, which can dampen international demand, as detailed in our guide on interest rates and exchange rates.
The Geopolitics of Oil: OPEC+, Spare Capacity, and Sanctions
Quick Answer: What Is OPEC+ and How Does It Influence Oil Markets?
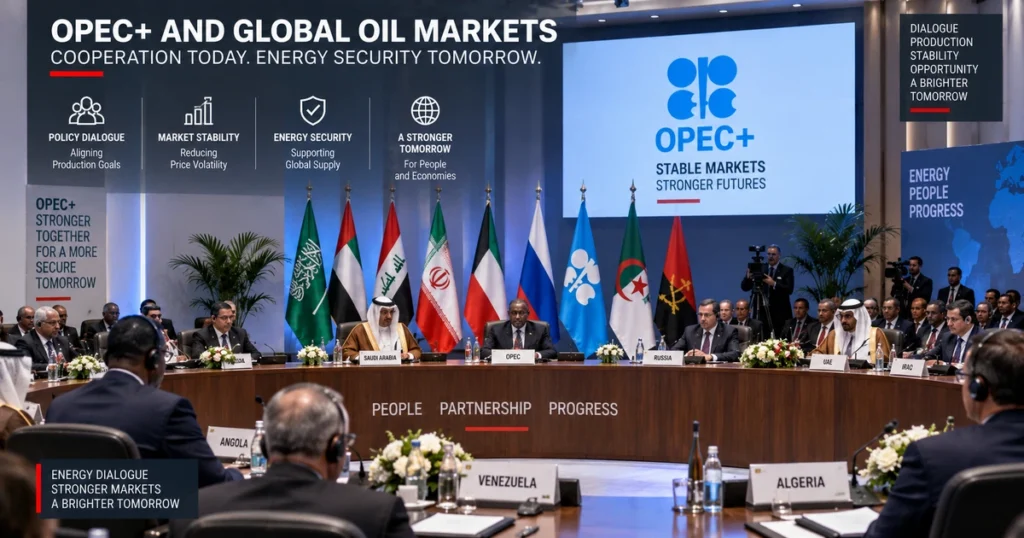
OPEC+ is a multilateral cooperation framework involving OPEC member nations alongside participating non-OPEC crude-producing countries. Participating nations coordinate production targets to influence global petroleum balances and inventory cushions, with specific voluntary or collective adjustments varying across agreements and market conditions.
Geopolitical developments act as a primary catalyst for systemic oil market volatility:
+---------------------------------------------------------------------------------------------------+
|                            THE OPEC+ COOPERATION FRAMEWORK                                        |
+---------------------+-----------------------------+-----------------------+-----------------------+
| FRAMEWORK BLOC      | MEMBER CHARACTERISTICS      | STRATEGIC OBJECTIVE   | MARKET INFLUENCE      |
+---------------------+-----------------------------+-----------------------+-----------------------+
| **OPEC Members**    | Sovereign Oil-Producing     | Coordinate petroleum  | Substantial share of  |
|                     | Member Nations              | production policies;  | global proven crude   |
|                     |                             | manage spare capacity | oil reserves          |
+---------------------+-----------------------------+-----------------------+-----------------------+
| **Participating     | Non-OPEC oil-producing      | Coordinate supply     | Additional production |
| Non-OPEC Producers**| countries participating in  | policies under agreed | and export capacity   |
|                     | the cooperation framework   | market arrangements   | in maritime trade     |
+---------------------+-----------------------------+-----------------------+-----------------------+
1. Global Spare Production Capacity
Spare capacity refers to production capability that can be brought online relatively quickly and sustained for a defined period, providing a buffer against unexpected supply disruptions.
- The Global Swing Producer Role: Historically, Saudi Arabia and key Gulf partners hold the primary share of global spare capacity.
- The Market Cushion: When spare capacity is ample, oil markets can absorb unexpected pipeline outages or export disruptions with muted price volatility. When spare capacity falls to narrow buffers, market prices tend to reflect a higher geopolitical risk premium.
2. Sanctions, Trade Flows, and Market Reconfiguration
Multilateral sanctions on major petroleum producers have altered traditional maritime trade patterns:
- Reconfiguration of Asian Cargoes: Significant crude volumes originally marketed to European destinations have shifted toward major Asian consumer economies, including India and China, trading at commercial discounts against Brent.
- Maritime Tanker Reallocation: A segment of the global tanker fleet operates under alternative insurance, registry, and commercial arrangements, utilizing ship-to-ship (STS) cargo transfers to maintain exports under international trade restrictions.
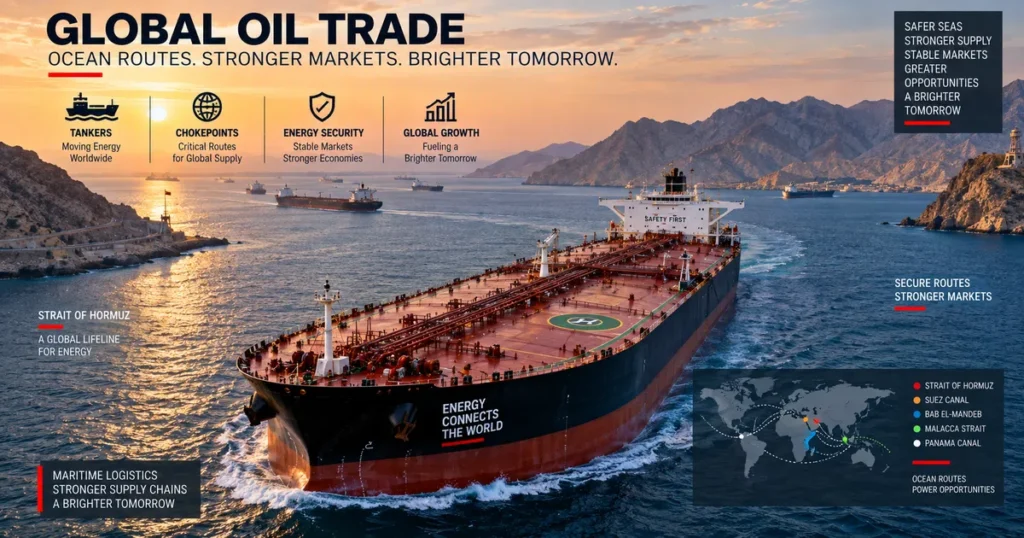
Maritime Logistics: Chokepoints, VLCC Charters, and Floating Storage
Quick Answer: How Is Crude Oil Transported Across the Globe?
A large majority of globally traded crude oil moves by sea, transported by Very Large Crude Carriers (VLCCs) and Suezmax tankers across oceanic routes, alongside intercontinental pipeline networks. Maritime oil trade passes through narrow, strategic geographic chokepoints vulnerable to transit disruptions and geopolitical tensions.
Critical maritime corridors handle vast volumes of liquid petroleum daily:
                      ┌─────────────────────────────────────────┐
                      │    STRATEGIC MARITIME TRANSIT STRAITS   │
                      └────────────────────┬────────────────────┘
                                           │
         ┌──────────────────┬──────────────┴──────────────┬──────────────────┐
         │                  │                             │                  │
         ▼                  ▼                             ▼                  ▼
┌──────────────────┐┌──────────────────┐        ┌──────────────────┐┌──────────────────┐
│ STRAIT OF HORMUZ ││ STRAIT OF MALACCA│        │ SUEZ CANAL / SUMED││ BAB EL-MANDEB    │
│ Persian Gulf to  ││ Indian Ocean to  │        │ Red Sea to       ││ Red Sea Southern │
│ Arabian Sea      ││ Pacific Basin    │        │ Mediterranean    ││ Entrance Gate    │
│ Primary Global   ││ Major Asian      │        │ European Transit ││ Middle East-     │
│ Maritime Artery  ││ Consumer Lifeline│        │ Pipeline Link    ││ European Route   │
└──────────────────┘└──────────────────┘        └──────────────────┘└──────────────────┘
1. The Strait of Hormuz
Connecting the Persian Gulf to the Gulf of Oman and Arabian Sea, the Strait of Hormuz is the world’s most critical petroleum transit chokepoint. Because alternative overland pipeline bypass options are limited relative to total Gulf output, a major disruption to Hormuz flows could place significant upward pressure on international oil prices, depending on the scale and duration of the event.
2. Floating Storage Arbitrage in Contango
During acute market gluts when supply outpaces land-based storage capacity:
- The Contango Carry Trade: When forward futures trade at a substantial premium over spot prices ($F > S$), trading desks evaluate the economics of chartering a VLCC tanker as a floating storage container.
- If the futures spread exceeds the tanker charter rate, maritime insurance, fuel boil-off, and financing costs, market participants can purchase spot crude, store it offshore, and sell forward futures contracts, locking in an arbitrage carry return.
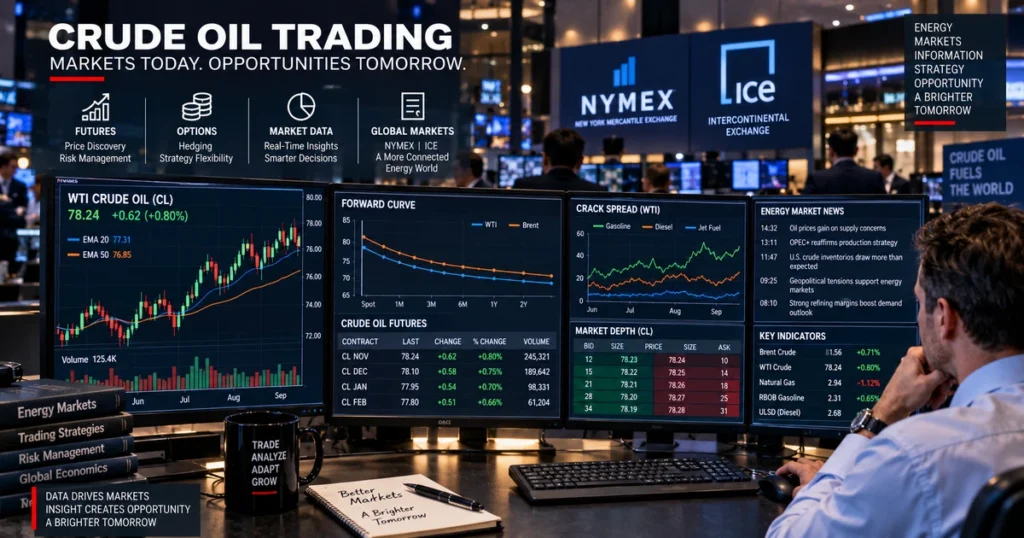
The Financialization of Crude Oil: Futures Curves, COT, and Arbitrage
Quick Answer: How Do Oil Futures Markets Work?
Crude oil futures are standardized exchange contracts that allow producers, refiners, and commercial consumers to hedge physical price exposure, while financial allocators provide market liquidity. Pricing across contract maturities forms the forward curve: Contango (deferred contracts trading above prompt prices) indicates storage carry and physical availability, while Backwardation (prompt prices trading above deferred contracts) signals immediate inventory tightness.
The term structure of futures contracts reflects current physical supply-demand balance and carrying costs:
Price ($)
  ▲
  │                                      CONTANGO (Futures > Spot)
  │                                     ┌─────────────────────────
  │                                ┌───┘  Upward-sloping curve:
  │                           ┌───┘       Storage availability & financing carry
  │                      ┌───┘
  ├─────────────────┬───┘
  │  SPOT PRICE     │
  ├─────────────────┴───┐
  │                      └───┐
  │                           └───┐       BACKWARDATION (Spot > Futures)
  │                                └───┐  Downward-sloping curve:
  │                                     └─────────────────────────
  │                                       Inventory tightness & convenience yield
  └─────────────────────────────────────────────────────────────────► Time to Expiration
1. Backwardation vs. Contango in Energy Portfolios
- Backwardation ($S > F$): Prompt physical delivery commands a premium because market participants place high value on immediate inventory access (convenience yield). When physical supplies are tight, inventories draw down, and long futures investors can benefit from positive roll yield contributions as deferred contracts converge toward the spot price near expiration.
- Contango ($F > S$): Prompt oil trades at a discount to deferred contracts, reflecting financing, insurance, and storage costs ($r + u$). In prolonged contango markets, index funds rolling expiring prompt-month contracts into higher-priced deferred contracts can experience negative roll yield drag over time.
2. Commitments of Traders (COT) Reports
Published weekly by the Commodity Futures Trading Commission (CFTC), the COT report categorizes open interest across regulated energy markets:
- Commercial Participants (Producers/Merchants): Energy exploration companies, integrated refiners, and physical merchants managing cash-market price exposure.
- Non-Commercial / Managed Money: Macro hedge funds, quantitative CTAs, and institutional asset managers deploying risk capital based on macroeconomic trends, technical indicators, and forward curve spreads.
Crude Oil in India: Import Dependence, Refineries, and Strategic Reserves
Quick Answer: What Is India’s Role in the Global Crude Oil Market?
India is the world’s third-largest consumer and importer of crude oil, with crude-oil import dependency at around 85% to 88% of consumption in recent PPAC data. India operates large, highly complex coastal refineries—including the Jamnagar complex—and manages domestic price risk through contracts traded on the Multi Commodity Exchange (MCX).
India’s economic trajectory is closely linked to international petroleum pricing:
+---------------------------------------------------------------------------------------------------+
|                             INDIA CRUDE OIL IMPORT & REFINING DYNAMICS                            |
+---------------------+-----------------------------+-----------------------+-----------------------+
| PARAMETER           | OPERATIONAL CHARACTERISTIC  | PRIMARY REFINING HUBS | MACROECONOMIC IMPACT  |
+---------------------+-----------------------------+-----------------------+-----------------------+
| **Import Reliance** | High crude-oil import       | Jamnagar (Reliance),  | Current Account       |
|                     | dependence (high-80% range) | Vadinar (Nayara),     | Deficit (CAD) swings; |
|                     | per PPAC national data      | Paradip (IOCL)        | Rupee (INR) valuation |
+---------------------+-----------------------------+-----------------------+-----------------------+
| **Primary Sources** | Russia, Iraq, Saudi Arabia, | Coastal, highly       | Fuel inflation, fiscal|
|                     | UAE, West Africa            | complex refining hubs | policy, transport cost|
+---------------------+-----------------------------+-----------------------+-----------------------+
| **Domestic Market** | MCX Crude Oil Futures       | Settled against NYMEX | Transparent hedging   |
| **Trading Venue**   | (`CRUDEOIL`)                | WTI benchmark prices  | for domestic refiners |
+---------------------+-----------------------------+-----------------------+-----------------------+
1. Macroeconomic Transmission Channels
Because India is a major net importer of liquid hydrocarbons:
- Trade Balance Sensitivity: A sustained increase in crude oil prices can materially raise India’s annual import bill, with the precise impact depending on import volumes, realized crude grades, exchange rates, and refined-product export margins.
- Refining Export Capacity: Despite relying on imported crude feedstock, India is an important regional exporter of finished petroleum products, processing diverse crude streams into Euro-VI specification transport fuels at coastal complexes.
2. Strategic Petroleum Reserves (ISPRL)
Managed by the Indian Strategic Petroleum Reserves Limited (ISPRL), India maintains dedicated underground unlined rock cavern storage facilities at Visakhapatnam, Mangalore, and Padur, providing a sovereign physical inventory buffer to mitigate supply shocks and maritime import disruptions.
How to Invest in Crude Oil: Investment Vehicles
Quick Answer: How Can Allocators Gain Exposure to Crude Oil?
Investors access crude oil through four primary pathways: Exchange-Traded Products (ETPs) (including USO and other futures-linked oil ETPs), Direct Exchange-Traded Futures & Options on NYMEX and ICE, Integrated Energy Equities (supermajors like ExxonMobil, Chevron, Shell, and BP), and Energy Sector Mutual Funds.
+---------------------------------------------------------------------------------------------------+
|                             CRUDE OIL INVESTMENT ACCESS PATHWAYS                                  |
+---------------------+-----------------------------+-----------------------+-----------------------+
| ACCESS PATHWAY      | REPRESENTATIVE VEHICLES     | PRIMARY ADVANTAGES    | STRUCTURAL LIMITS     |
+---------------------+-----------------------------+-----------------------+-----------------------+
| **Energy Commodity  | USO and other futures-      | High liquidity across | Futures roll mechanics|
| ETPs (Futures)**    | linked oil ETPs             | standard brokerage    | can create contango   |
|                     |                             | accounts              | drag over time        |
+---------------------+-----------------------------+-----------------------+-----------------------+
| **Exchange-Traded   | NYMEX WTI (`CL`), ICE Brent | Pure price discovery; | Substantial leverage; |
| Futures & Options** | (`B`) direct contracts      | capital efficiency    | margin call liability |
+---------------------+-----------------------------+-----------------------+-----------------------+
| **Integrated Energy | ExxonMobil, Chevron, Shell, | Operating leverage;   | Equity market beta;   |
| Producer Equities** | TotalEnergies, BP           | potential dividend inc| corporate governance  |
+---------------------+-----------------------------+-----------------------+-----------------------+
| **Oilfield Services | SLB (Schlumberger),         | High beta to upstream | Extreme cyclicality;  |
| & Equipment (OFS)** | Baker Hughes, Halliburton   | exploration CapEx     | capital intensity     |
+---------------------+-----------------------------+-----------------------+-----------------------+
Understanding Energy Equity Operational Leverage
Many institutional allocators buy shares of integrated energy producers—frequently weighted on major global stock exchanges, including the Canada TSX and the Australia ASX 200—as an equity proxy for physical petroleum:
- An exploration firm with an operating cost of $40 per barrel sees its unit cash margin expand from $20 to $40 per barrel (+100%) if crude prices rise from $60 to $80 (+33.3%).
- Note: Corporate energy equities also carry management risks, debt service costs, and broad market volatility, dynamics detailed in our treatise on what is market capitalization.
Comparative Analysis: Crude Oil vs. Other Asset Classes
Quick Answer: How Does Crude Oil Compare to Stocks, Bonds, and Gold?
Crude oil is a consumable energy commodity that generates no contractual dividends or bond coupons. Unlike gold, which is a durable physical asset often used as a store of value, crude oil must be refined and consumed, making its valuation sensitive to immediate industrial activity, global trade volumes, and physical inventory balances.
| Dimension / Asset Class | Crude Oil (Petroleum) | Physical Gold Bullion | Corporate Equities (Stocks) | Government Bonds |
|---|---|---|---|---|
| Asset Category | Consumable Energy Commodity | Monetary Real Asset | Corporate Ownership Claim | Sovereign Debt Contract |
| Contractual Cash Flow | None inherently | None inherently | Discretionary Dividends | Contractual Coupon Payments |
| Primary Valuation Basis | Supply-Demand Balance & Carry | Real Yields & Central Banks | Discounted Cash Flows (DCF) | Yield to Maturity (YTM) |
| Inflation Sensitivity | Can respond to inflation expectations & supply-demand | Long-Term Wealth Store | Variable by pricing power | Inflation reduces real yield |
| Supply Elasticity | Inelastic Short-Term | Inelastic Annual Mine Rate | Corporate Capital Output | Sovereign Monetary Policy |
| Storage / Degradation | High Cost / Containment Risk | Minimal Cost / Vaulted | Digital Registry | Digital Registry |
Common Myths vs. Empirical Facts
- Myth: The world is about to run out of crude oil permanently (“Peak Oil Supply”).
- Fact: Substantial hydrocarbon volumes remain in place globally. Historically, sustained price increases incentivize deepwater exploration, enhanced oil recovery (EOR), and unconventional extraction technologies that transform previously sub-economic resources into commercially viable reserves. The long-term constraint relates more to capital allocation and substitute technologies than immediate physical exhaustion.
- Myth: Buying an oil ETF like USO gives you the exact return of physical spot crude oil.
- Fact: Because retail exchange-traded funds do not store physical crude oil, they invest primarily in futures contracts. When oil markets trade in persistent contango, funds incur roll yield drag by selling lower-priced expiring contracts and purchasing higher-priced deferred contracts, causing performance to diverge from spot price changes over time.
- Myth: OPEC completely controls and dictates the price of oil at will.
- Fact: OPEC and non-OPEC participating nations coordinate production targets to influence market balance, but they cannot eliminate the effects of broad economic contractions or alternative supply responses from non-participating producers.
- Myth: Speculative financial traders drive all oil price volatility.
- Fact: While financial positioning provides market liquidity and can influence short-term price momentum, physical market prices clear where commercial producers, refiners, and consumers trade real physical barrels. Many speculative traders close or roll futures positions before expiry rather than entering the physical delivery process, while physical delivery is generally handled by commercial participants equipped and eligible to manage the underlying commodity.
Frequently Asked Questions
What is the simplest definition of crude oil?
Crude oil is a naturally occurring, unrefined liquid petroleum composed predominantly of hydrocarbons extracted from geological formations and refined into commercial fuels, lubricants, and petrochemical feedstocks.
What is the difference between Brent and WTI crude oil?
WTI (West Texas Intermediate) is a major North American light, sweet crude benchmark produced in the United States, with NYMEX WTI futures physically delivered at Cushing, Oklahoma. Brent is a waterborne benchmark complex built around North Sea crude streams, with WTI Midland incorporated into the Brent pricing basket since 2023. ICE Brent futures are cash-settled against the ICE Brent Index, while Exchange for Physicals (EFPs) help link the futures market with the underlying physical crude market.
What is a crack spread in crude oil refining?
A crack spread is the price differential between raw crude oil feedstocks and the refined petroleum products (gasoline and distillate) produced from it. The 3:2:1 crack spread approximates the theoretical gross refining margin of converting three barrels of crude into two barrels of gasoline and one barrel of diesel.
How does OPEC+ influence crude oil prices?
OPEC+ coordinates production targets among member countries to balance global oil markets. By adjusting production targets and managing spare production capacity, the alliance influences global inventory cushions and market-clearing prices.
Why does a strong US Dollar typically pressure crude oil prices lower?
Because primary international crude oil benchmarks are denominated and settled in US Dollars, a stronger dollar makes crude imports more expensive in local currency terms for non-dollar economies, which can reduce consumption and put downward pressure on dollar-quoted oil prices.
Strategic Summary & Core Takeaways
- Foundational Economic Energy: Crude oil remains a primary energy input for global transport and industrial petrochemicals, classified by its density (API gravity) and chemical sulfur concentration.
- Two Core Benchmarks: The global market is anchored by WTI (US domestic pipeline reference centered at Cushing, OK) and Brent Crude (international waterborne reference with optional cash settlement against the ICE Brent Index).
- Refining Dynamics and Crack Spreads: Crude oil has limited direct utility until refined via atmospheric distillation and secondary upgrading units into finished fuels, with the 3:2:1 crack spread functioning as an indicator of refining margins.
- Geopolitics and Maritime Chokepoints: OPEC+ policy agreements, geopolitical transit chokepoints (such as the Strait of Hormuz), and international spare capacity provide the framework for supply-side dynamics.
- Diverse Exposure Pathways: Market participants access crude oil exposure through futures-linked ETPs, exchange-cleared derivatives, integrated oil and gas producers, or specialized oilfield service companies.
Next Reading Suggestions
- Hard Commodities: The Complete Guide to Extracted Resources, Energy Markets, and Industrial Metals
- Commodity Prices: How They Are Determined, Key Drivers, and Futures Pricing
- What Is a Commodity? The Complete Guide to Fungible Goods, Raw Materials, and Global Market Value
- Commodity Exchange: The Complete Guide to Global Trading Hubs, Contract Standardization, and Clearing Mechanics
- What Is Gold? The Complete Guide to Real Money, Store of Value & Why It Matters
- How Stock Prices Are Determined: Market Microstructure, Supply and Demand, and Valuation
- What Is Market Capitalization? The Complete Guide to Market Cap, Company Size, and Valuation
- Interest Rates and Exchange Rates: The Complete Guide to Global Currency Pricing
- Fed Rate Cuts & Global Liquidity: The Complete Guide to Interest Rates, the Fed Balance Sheet, and Asset Markets
- Canada TSX: The Complete Guide to the S&P/TSX Composite Index, Methodology, and Market Structure
- Australia ASX 200: The Complete Guide to the S&P/ASX 200 Index, Methodology, and Market Structure
Author Box & E-E-A-T Verification
Written & Researched By: CurrencyPlans Editorial Research Team
Last Updated & Methodologically Reviewed: September 2026
Editorial Review & Methodological Standards: This educational guide to crude oil is developed using petroleum engineering benchmarks, regulatory operating statutes, and primary derivatives exchange specifications. Structural pricing frameworks—including pipeline delivery protocols, refinery crack spreads, API assay parameters, and futures roll yield mechanics—are informed by publications and official contract rules from the U.S. Energy Information Administration (EIA), the International Energy Agency (IEA), the Organization of the Petroleum Exporting Countries (OPEC), CME Group, the Intercontinental Exchange (ICE), and the Commodity Futures Trading Commission (CFTC).
Educational References & Market Data Sources
For official contract specifications, physical grading parameters, and energy balance sheets, consult primary regulatory and statistical portals directly:
- U.S. Energy Information Administration (Petroleum Supply Monthly & Weekly Status): EIA
- International Energy Agency (Oil Market Reports & Global Energy Outlook): IEA
- Organization of the Petroleum Exporting Countries (Monthly Oil Market Report – MOMR): OPEC
- CME Group (Light Sweet Crude Oil NYMEX WTI Product Specifications): CME Group
- Intercontinental Exchange (ICE Brent Crude Futures & Deliverable Rules): ICE
- U.S. Commodity Futures Trading Commission (Commitments of Traders Reports): CFTC
- Multi Commodity Exchange of India (MCX Crude Oil Contract Specifications): MCX India
Educational Disclaimer
This guide is prepared strictly for educational, research, and informational purposes and does not constitute personalized financial, investment, trading, legal, or tax advice. Commodity spot markets, derivative futures contracts, and energy equities carry substantial market and capital risks. Past market pricing patterns and historical futures forward curve shapes do not guarantee future financial returns. Always conduct independent due diligence and consult a licensed fiduciary financial advisor before allocating investment capital.

