
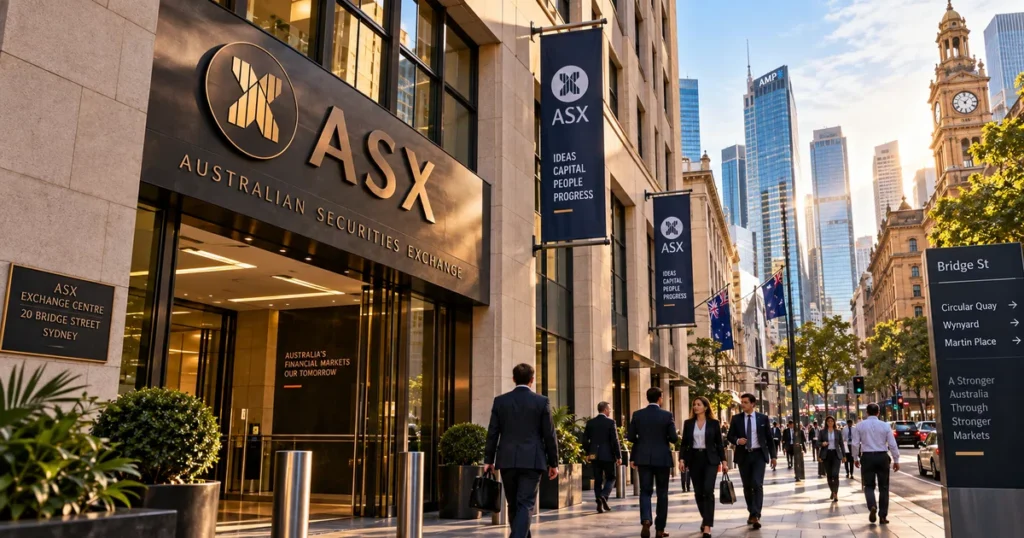
The ASX 200 (officially the S&P/ASX 200) serves as the preeminent investable benchmark for the Australian equity market. Operated through the Australian Securities Exchange (ASX) and co-administered with S&P Dow Jones Indices, the index tracks the performance of the 200 largest eligible public corporations listed in Australia.
Representing approximately 80% of total Australian equity market capitalization, the benchmark serves as the primary performance hurdle for institutional fund managers, superannuation retirement pools, and global exchange-traded funds (ETFs). Understanding the ASX 200 requires analyzing its float-adjusted market capitalization framework, its structural concentration in commercial banking and global resources, its sensitivity to Asian industrial commodity demand, and the monetary policies of the Reserve Bank of Australia (RBA), complementing our foundational study on how stock prices are determined.
Executive Summary: Structure of the Australian Capital Market
Quick Answer: What Is the ASX 200?
The ASX 200 (S&P/ASX 200, ticker:
XJO) is an investable, float-adjusted market-capitalization-weighted benchmark comprising the 200 largest and most liquid companies listed on the Australian Securities Exchange. Managed by S&P Dow Jones Indices, the index covers approximately 80% of Australian equity market capitalization. While the standard headlineXJOis a Price Return index, investors and fund managers evaluate total performance using dividend-reinvesting benchmarks: the S&P/ASX 200 Gross Total Return Index (XJT) and the commonly referenced end-of-day S&P/ASX 200 Accumulation Index (XJOA).
The Australian financial ecosystem is characterized by one of the largest pension savings pools in the world (the Australian Superannuation system), creating a significant structural pool of institutional capital invested across Australian equities.
                        ┌──────────────────────────────────────────────┐
                        │      AUSTRALIAN PUBLIC CAPITAL MARKET        │
                        └──────────────────────┬───────────────────────┘
                                               │
         ┌─────────────────────────────────────┴─────────────────────────────────────┐
         │                                                                           │
         ▼                                                                           ▼
┌──────────────────────────────────────┐                   ┌──────────────────────────────────────┐
│ S&P/ASX 200 INDEX (`XJO` / `XJT`)    │                   │ ALL ORDINARIES INDEX (`XAO`)         │
├──────────────────────────────────────┤                   ├──────────────────────────────────────┤
│ * Primary Institutional Benchmark    │                   │ * Historical Broad-Market Indicator  │
│ * Top 200 liquid, investable stocks  │                   │ * 500 largest listed companies       │
│ * Float-adjusted market-cap weighted │                   │ * Pure market-cap (non-investable)   │
│ * Underpins major institutional ETFs │                   │ * No strict institutional liquidity  │
│   and index futures (SPI 200 on ASX) │                   │   screens or minimum IWF hurdle      │
└──────────────────────────────────────┘                   └──────────────────────────────────────┘
The index operates on three core institutional pillars:
- Float-Adjusted Investability: Weights adjust to reflect the portion of shares considered available to public investors through the Investable Weight Factor (IWF).
- High Liquidity Screening: Candidates must meet minimum relative turnover standards over a trailing three-month evaluation period, helping ensure that index constituents meet minimum liquidity standards suitable for institutional investment.
- Superannuation Capital Channel: Compulsory retirement contributions create a significant structural pool of institutional capital that is invested across Australian equities, contributing to the depth and liquidity of the domestic equity market.
The Structural Evolution: From All Ordinaries to S&P/ASX Partnership

Quick Answer: How Has Australia’s Benchmark Evolved?
Historically, Australia’s headline stock gauge was the All Ordinaries Index (
XAO), established in 1980. However, because the All Ordinaries included illiquid smaller companies and lacked float adjustments, the ASX partnered with Standard & Poor’s in April 2000 to launch the S&P/ASX 200, establishing the ASX 200 as the institutional investable benchmark alongside the broader All Ordinaries.
The historical modernization of Australian equity trading reflects several major structural milestones:
- 1861–1937 (State Exchange Era): Independent stock exchanges emerge in Melbourne, Sydney, Brisbane, Adelaide, Hobart, and Perth, operating as regional trading floors.
- 1980 (All Ordinaries Launch): The Australian market introduces the All Ordinaries Index, standardizing broad equity measurements back-calculated to 1970.
- 1987 (Unified National Exchange): Australia’s six state exchanges amalgamate under federal legislation to form the centralized Australian Stock Exchange Limited (ASX).
- 1990 (SEATS Full Automation): The ASX completely dismantles its physical trading floors, becoming an early global pioneer in electronic screen trading via the Stock Exchange Automated Trading System (SEATS).
- 1998 (ASX Demutualization & IPO): The ASX becomes the first exchange in the world to demutualize and list its own shares on its own market.
- April 2000 (S&P/ASX Benchmark Modernization): The ASX partners with S&P to launch the S&P/ASX index series—headlined by the S&P/ASX 200 (
XJO)—establishing an institutional investable standard for passive funds and derivatives. - 2006 (SFE Merger): The Australian Stock Exchange merges with the Sydney Futures Exchange (SFE), creating the modern Australian Securities Exchange Group.
Eligibility & Inclusion Criteria: Three-Month Liquidity & 15% Minimum IWF Rules
Quick Answer: How Does a Stock Qualify for the ASX 200?
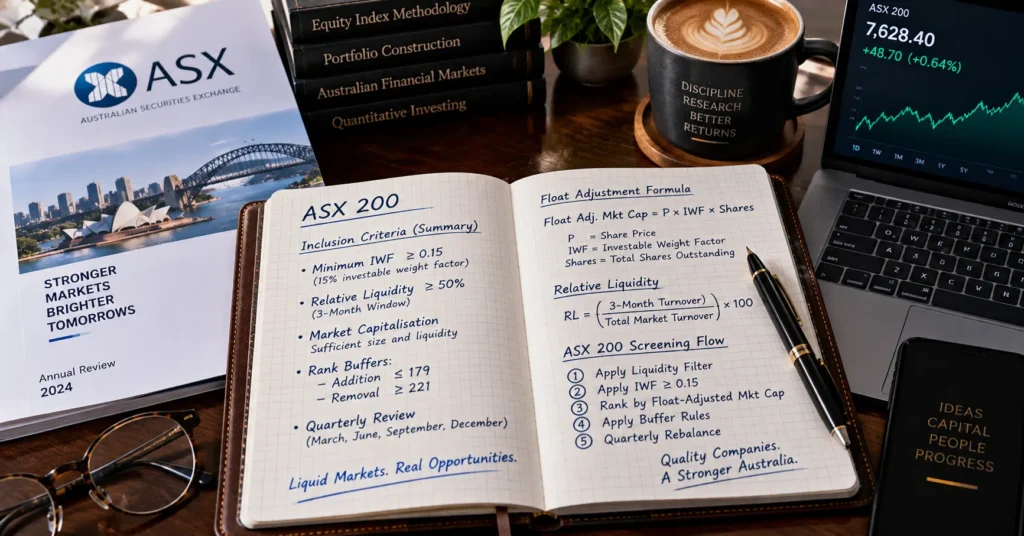
To enter the ASX 200, a company must be listed on the ASX, maintain eligible institutional free float, rank within the top tier of float-adjusted market capitalization, and satisfy a relative liquidity threshold of at least 50% over the preceding three months.
The S&P Australian Index Committee conducts formal quarterly index rebalancings in March, June, September, and December using defined criteria:
1. Eligible Security Types
Constituents are drawn from ordinary shares and eligible preferred equity stocks listed on the ASX. Preferred securities that are fixed-income in nature or provide a guaranteed fixed return are not eligible. Warrants, structured products, index funds, Exchange-Traded Funds (ETFs), and options contracts are excluded. Foreign-domiciled securities can also be eligible when listed on the ASX, including companies with primary or secondary listings (often traded via CHESS Depositary Interests, or CDIs).
2. Market Capitalization Ranking & Buffer Rules
- Inclusion Assessment: S&P DJI ranks candidate companies using daily average float-adjusted market capitalization over the trailing three-month evaluation period.
- The 200-Rank Boundary: Under the current selection buffers, a non-constituent ranked 179th or higher can qualify for addition, while an existing constituent generally remains protected until it falls to 221st or lower, subject to the methodology’s eligibility requirements and index committee procedures.
3. Institutional Liquidity Hurdles
Liquidity is evaluated through Relative Liquidity:
$$\text{Relative Liquidity} = \frac{\text{Median Daily Liquidity of Stock } i}{\text{Median Market Liquidity across All ASX Equities}}$$
A candidate stock must demonstrate a relative liquidity of at least 50% (0.50) over the preceding three months. This helps ensure that only sufficiently liquid securities are eligible for the benchmark.
4. Investable Weight Factor (IWF) Minimums
S&P assigns an Investable Weight Factor (IWF) from 0.0 to 1.0 to determine the proportion of a security’s equity capital considered investable:
- Government shareholdings.
- Strategic corporate holdings and parent-company ownership pools.
- Cross-holdings and insider holdings (directors, founders) exceeding 5%.
- Current Minimum Float Threshold: Except for the All Ordinaries, a company generally must have a minimum IWF of 0.15 (15% free float) to be eligible for new index inclusion.
Weighting Architecture: Float-Adjusted Market Cap & Divisor Formula
Quick Answer: How Is the ASX 200 Calculated?
The ASX 200 is calculated using float-adjusted market capitalization weighting. Each company’s index weight is determined by multiplying its share price by its publicly available share count (via the Investable Weight Factor), scaled by an institutional Index Divisor to preserve calculation continuity.
The standard calculation formula follows international S&P methodology:
$$\text{Index Level} = \frac{\sum_{i=1}^{N} (P_i \times Q_i \times \text{IWF}_i)}{\text{Divisor}}$$
Where:
- $P_i$ is the prevailing market price of constituent $i$ on the ASX.
- $Q_i$ represents the number of shares outstanding for constituent $i$.
- $\text{IWF}_i$ is the Investable Weight Factor, isolating publicly tradeable shares.
- $\text{Divisor}$ is the proprietary scaling figure adjusted during corporate actions (such as secondary share issuances, spin-offs, and capital returns) to ensure index levels remain unbroken by non-market events, following the same general divisor principles detailed in our USA S&P 500 guide.
Price Return (XJO) vs. Gross Total Return (XJT) & Accumulation (XJOA)
- S&P/ASX 200 (
XJO): The widely quoted headline index. It is calculated on a Price Return basis, tracking capital price movements and dropping mathematically when constituents trade ex-dividend. - S&P/ASX 200 Gross Total Return (
XJT) & Accumulation (XJOA): The S&P/ASX 200 Gross Total Return Index (XJT) incorporates cash dividends, while the end-of-day S&P/ASX 200 Accumulation Index (XJOA) is the commonly referenced accumulation version. Because Australian corporate equities distribute substantial dividend yields, these dividend-reinvesting versions can materially exceed the Price Return index over longer periods, matching the gross total return mechanics found in the Germany DAX 40.
11 GICS Sector Composition: Banking Oligopoly and Materials Heavyweights
Quick Answer: What Sectors Dominate the ASX 200?
The ASX 200 is structurally dominated by Financials and Materials. Together, these two sectors represented roughly 59.8% (nearly 60%) of the entire index as of August 31, 2026, making Australian equities heavily geared toward commercial lending spreads and international mining cycles.
Constituents are categorized under the Global Industry Classification Standard (GICS) across 11 core operating sectors:
Current ASX 200 Sector Table
| GICS Sector | Index Weight* | Primary Economic Role | Representative Blue-Chip Constituents |
| Financials | 32.1% | Major commercial banks, diversified financial services, and wealth managers | Commonwealth Bank of Australia (CBA), National Australia Bank (NAB), Westpac (WBC), ANZ Group (ANZ), Macquarie Group (MQG) |
| Materials | 27.7% | Global iron ore miners, gold, copper, and other metals | BHP Group (BHP), Rio Tinto (RIO), Fortescue (FMG), Newmont Corporation (NEM), South32 (S32) |
| Industrials | 6.6% | Infrastructure, logistics, transport, and industrial services | Transurban Group (TCL), Brambles (BXB), Qantas Airways (QAN) |
| Health Care | 6.5% | Biotechnology, medical devices, health services, and pharmaceuticals | CSL Limited (CSL), Cochlear (COH), ResMed (RMD), Sonic Healthcare (SHL) |
| Consumer Discretionary | 6.5% | Retail, gaming, consumer services, and discretionary goods | Wesfarmers (WES), Aristocrat Leisure (ALL), JB Hi-Fi (JBH) |
| Real Estate (A-REIT) | 5.4% | Industrial, retail, and commercial property operators | Goodman Group (GMG), Scentre Group (SCG), Stockland (SGP) |
| Energy | 4.6% | LNG, oil, gas, and energy production | Woodside Energy (WDS), Santos Limited (STO), Ampol (ALD) |
| Consumer Staples | 3.7% | Supermarkets, food, beverages, and essential consumer products | Woolworths Group (WOW), Coles Group (COL), Treasury Wine Estates (TWE) |
| Communication Services | 3.3% | Telecommunications and digital communication platforms | Telstra Group (TLS), REA Group (REA), TPG Telecom (TPG) |
| Information Technology | 2.1% | Software and technology platforms | Xero Limited (XRO), WiseTech Global (WTC), TechnologyOne (TNE) |
| Utilities | 1.4% | Electricity, gas, and infrastructure utilities | Origin Energy (ORG), APA Group (APA) |
*Index weights as of August 31, 2026; weights change with market prices and index rebalancing.
The “Big Four” Banking Moat
Australia’s banking sector is characterized by an entrenched oligopoly consisting of the “Big Four”: Commonwealth Bank of Australia (CBA), National Australia Bank (NAB), Westpac (WBC), and ANZ Group (ANZ). Supervised by the Australian Prudential Regulation Authority (APRA), these institutions control the vast majority of the nation’s domestic residential mortgage market, generating recurring net interest income that supports high corporate dividend distributions.
The Mining Super-Cap Influence: BHP Group
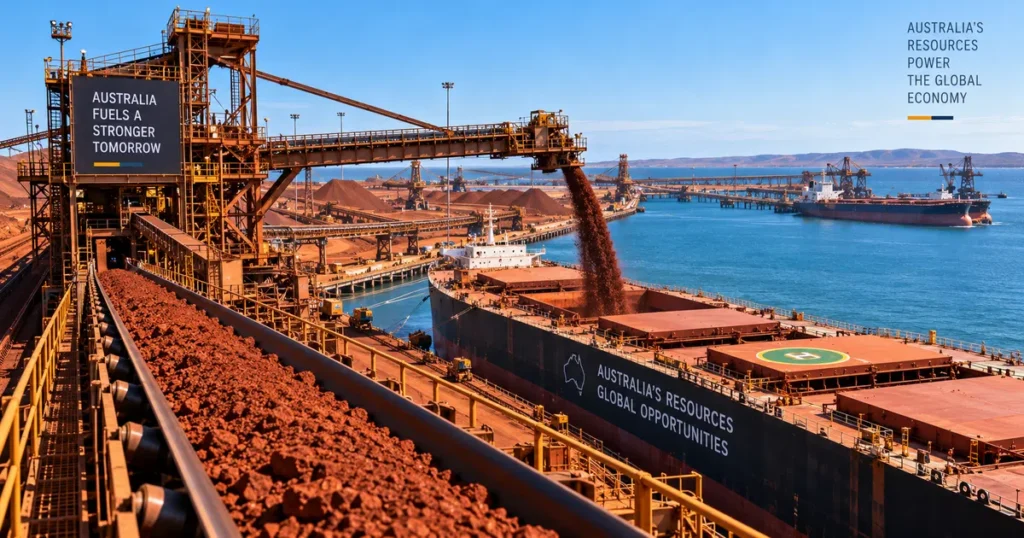
On the materials side, BHP Group represents one of the largest individual components in the benchmark. Because Australia is a leading global exporter of iron ore and metallurgical coal, major swings in Chinese steel production or seaborne commodity spot prices directly impact the earnings of BHP, Rio Tinto, and Fortescue, generating substantial sector beta across the index.
Macroeconomic Drivers: RBA Cash Rate, China Commodity Demand, and the Aussie Dollar
Quick Answer: What Macro Forces Drive the ASX 200?
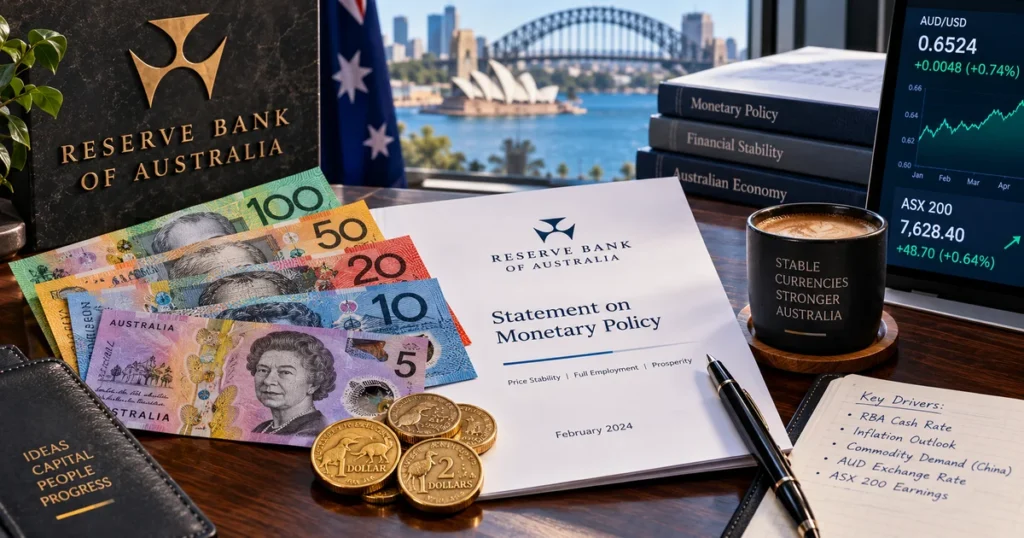
The ASX 200 is driven by three primary macroeconomic catalysts: Reserve Bank of Australia (RBA) cash rate targets, commodity demand from China and East Asia, and movements in the floating Australian Dollar (AUD), aligning with the principles explored in our guide on interest rates and exchange rates.
                      ┌─────────────────────────────────────────┐
                      │    MACRO TRANSMISSION CHANNELS TO ASX   │
                      └────────────────────┬────────────────────┘
                                           │
         ┌─────────────────────────────────┴─────────────────────────────────┐
         │                                                                   │
         ▼                                                                   ▼
┌──────────────────────────────────┐               ┌──────────────────────────────────┐
│ RBA MONETARY POLICY & CREDIT     │               │ GLOBAL COMMODITIES & TRADE       │
├──────────────────────────────────┤               ├──────────────────────────────────┤
│ * RBA Official Cash Rate:        │               │ * Chinese Industrial Production: │
│   Drives mortgage servicing and  │               │   Directly influences iron ore   │
│   commercial banking margins     │               │   and metallurgical coal volumes │
│ * Australian Housing Balance:    │               │ * Floating Aussie Dollar (AUD):  │
│   Bank loan provisioning shifts  │               │   Weak AUD can ease pressure     │
│   with domestic consumer credit  │               │   on AUD value of USD revenue    │
└──────────────────────────────────┘               └──────────────────────────────────┘
1. The Chinese Industrial Demand Transmission
Unlike domestic-focused indices, the resource segment of the ASX 200 is heavily tied to the Chinese economic cycle. China is Australia’s largest trading partner, consuming vast quantities of iron ore, lithium, and base metals. When Chinese industrial production expands or Beijing deploys fiscal infrastructure stimulus, Australian resource earnings and dividend expectations can rise. Conversely, a slowdown in Chinese construction directly pressures the Materials sector.
2. The Reserve Bank of Australia (RBA) Monetary Policy Channel
Because Financials account for roughly a third of the index, the RBA’s setting of the official Cash Rate influences equity valuations:
- Rate hikes generally support bank Net Interest Margins (NIM) in the initial phases, but prolonged high rates increase debt-service burdens on variable-rate mortgage holders, raising loan provisioning.
- Rate-cutting cycles lower borrowing costs, stimulating domestic retail spending and commercial property transactions, which benefits A-REITs and consumer sectors, dynamics analyzed in our study on fed rate cuts and global liquidity.
3. The Free-Floating Australian Dollar (AUD/USD)
The Australian Dollar is a commodity-linked, free-floating currency:
- Major Australian miners (which price their commodities in US Dollars on global markets while paying wages and taxes in Australian Dollars) can see pressure on costs ease when a weaker AUD boosts the Australian-dollar value of US-dollar-denominated commodity revenue.
- A stronger AUD lowers domestic import costs but compresses foreign revenue translation for global Australian corporations like CSL and Macquarie Group.
The Dividend Imputation System: Franking Credits Explained
Quick Answer: What Are Franking Credits and Why Do They Matter on the ASX 200?
Under Australia’s dividend imputation system, corporate tax paid by Australian companies can be credited to eligible domestic shareholders through franking credits (imputation credits). This mechanism is designed to reduce the effects of double taxation on eligible dividend income and can be particularly relevant to Australian investors and superannuation funds.
The Mechanics of Franking
When an Australian company is taxed at the 30% corporate tax rate applicable to standard corporate taxpayers, it can distribute dividends accompanied by franking credits:
- If a company distributes a fully franked dividend of A$70.00, it carries an attached tax credit of A$30.00 (representing the tax already paid by the company to the Australian Taxation Office).
- The Australian resident investor declares a grossed-up dividend income of A$100.00, but applies the A$30.00 credit against their personal tax liability.
- For zero-tax or low-tax entities (such as Australian superannuation funds in pension phase), excess franking credits can be refunded as cash by the Australian Taxation Office, providing an important mechanism for holding high-dividend blue chips like CBA, Westpac, and BHP.
Trading Mechanics: Modernized Single Opening, Continuous Matching, and Post Close
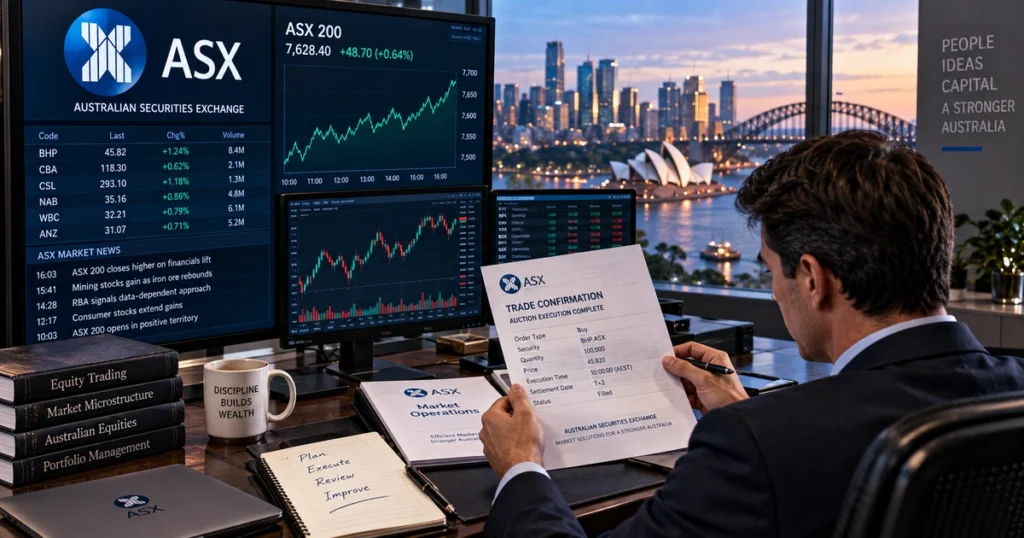
Quick Answer: When Does the Australian Securities Exchange Trade?
The ASX operates Monday through Friday, with continuous normal trading beginning at approximately 9:59:45 AM Sydney Time (AEST / AEDT). Since June 23, 2025, ASX cash equities utilize a modernized single opening-price auction rather than the former staggered five-group opening rotation.
Daily Trading Schedule (Sydney Time – AEST / AEDT):
- 07:00 AM – 09:59 AM (Pre-Opening Session): Orders can be entered and queued in preparation for the market open, but ASX Trade does not match orders during the pre-open phase.
- 09:59 AM – 09:59:45 AM (Opening Single Price Auction / OSPA): The OSPA begins during a randomized 15-second window starting at 09:59 AM. The opening auction establishes the opening price, followed by a levelling/buffering period before continuous trading begins.
- 09:59:45 AM – 04:00 PM (Normal Continuous Trading): Continuous electronic matching operates on a strict Price/Time priority basis, with the transition into normal trading subject to a randomized 15-second window.
- 04:00 PM – 04:10 PM (Pre-CSPA): Continuous matching ceases while orders can be entered, changed, or cancelled in preparation for the closing auction.
- 04:10 PM – 04:11 PM (Closing Single Price Auction / CSPA): The closing auction establishes the official daily closing price, with the auction starting at a randomized time within the 30-second window after 4:10 PM.
- 04:11 PM – 04:21:30 PM (Post Close): Eligible trades can execute at the established CSPA price under the ASX Post Close session rules.
- 04:21:30 PM onward (Adjust & End of Day): The market enters the subsequent adjustment and end-of-day administrative processing phases.
Benchmark Variations: S&P/ASX 200 vs. All Ordinaries vs. S&P/ASX 50
Quick Answer: How Does the ASX 200 Compare to Other Australian Benchmarks?
The S&P/ASX 200 is the institutional investable benchmark. The All Ordinaries (
XAO) is a broad-market gauge tracking 500 stocks without liquidity hurdles or minimum IWF, while the S&P/ASX 50 tracks Australia’s 50 largest corporations.
| Benchmark Dimension | S&P/ASX 200 (XJO) | All Ordinaries (XAO) | S&P/ASX 50 (XFL) | S&P/ASX Small Ordinaries (XSO) |
| Constituent Count | Exactly 200 | Top 500 listed stocks | Top 50 mega-caps | Stocks ranked 101 to 300 |
| Weighting Method | Float-Adjusted MCap | Total Market Cap | Float-Adjusted MCap | Float-Adjusted MCap |
| Market Coverage | ~80% of listed capital | ~95% of listed capital | ~60% of listed capital | Small/Mid-cap segment |
| Primary Use Case | ETFs, Institutional mandates | Historical economic gauge | Mega-cap derivatives | Small- and mid-cap exposure |
| Rebalancing Frequency | Quarterly (March/June/Sept/Dec) | Semi-Annual (March/September) | Quarterly (March/June/Sept/Dec) | When changes occur in underlying index |
How to Gain Exposure to Australian Equities & the ASX 200
Quick Answer: How Do Investors Access the ASX 200 and Australian Equities?
Global and domestic allocators can gain exposure to the ASX 200 or the broader Australian equity market through ETFs, individual Australian equities, or exchange-cleared SPI 200 Futures contracts.
+---------------------------------------------------------------------------------------------------+
|                     AUSTRALIAN EQUITY & ASX 200 INVESTMENT ACCESS ROUTES                          |
+---------------------+-----------------------------+-----------------------+-----------------------+
| ACCESS VEHICLE      | TICKER EXAMPLES             | BENCHMARK EXPOSURE    | TARGET INVESTOR       |
+---------------------+-----------------------------+-----------------------+-----------------------+
| **Core ASX 200 ETF**| iShares Core S&P/ASX 200    | S&P/ASX 200 Index     | Long-term super funds,|
|                     | (`IOZ` on ASX)              |                       | retail core allocators|
| **Broad Australian  | Vanguard Australian Shares  | S&P/ASX 300 Index     | Broad Australian total|
| Market ETF**        | (`VAS` on ASX)              |                       | market exposure       |
| **Large-Cap 200 ETF**| BetaShares Australia 200   | Solactive Australia   | Low-cost 200 large-cap|
|                     | (`A200` on ASX)             | 200 Index             | Australian exposure   |
| **U.S.-Listed ETF** | iShares MSCI Australia      | MSCI Australia Index  | International allocators|
|                     | (`EWA` on NYSE Arca)        | (USD-denominated)     | seeking AUD exposure  |
| **Index Futures**   | SPI 200 Index Futures       | S&P/ASX 200 Index   | Institutional hedgers,|
|                     | (ASX 24 contract code `AP`) | (Cleared on ASX 24)   | quantitative traders  |
+---------------------+-----------------------------+-----------------------+-----------------------+
Institutional ETF Landscape
The domestic Australian ETF market offers low-cost funds providing targeted access to Australian equities. Investors seeking dedicated replication of the S&P/ASX 200 benchmark utilize funds like the iShares Core S&P/ASX 200 ETF (IOZ), while vehicles such as VAS (S&P/ASX 300) and A200 (Solactive Australia 200) serve related portfolio allocation roles across the broader Australian market.
Comparative Analysis: ASX 200 vs. Global Equity Benchmarks
Quick Answer: How Does the ASX 200 Compare to Global Peers?
The ASX 200 features a heavy concentration in banking and resource extraction, paired with solid dividend cash flows. Compared to tech-heavy U.S. markets or industrial European exchanges, it functions as a resource-backed, financial-heavy benchmark.
| Dimension / Metric | Australia ASX 200 (XJO) | Canada S&P/TSX Composite | USA S&P 500 (SPX) | Germany DAX 40 (DAX) |
| Constituent Count | Exactly 200 | ~215–240 stocks | 500 Large-Cap US firms | 40 Major German firms |
| Weighting Method | Float-Adjusted MCap | Float-Adjusted MCap | Float-Adjusted MCap | Free-Float MCap |
| Primary Currency | Australian Dollar (AUD) | Canadian Dollar (CAD) | US Dollar (USD) | Euro (EUR) |
| Headline Return Type | Price Return | Price Return | Price Return | Total Return (Gross) |
| Top Sector Bias | Financials & Materials | Financials & Materials | Information Technology | Industrials & Autos |
| Constituent Cap | None (Pure Float) | None (10% on select sub) | None (Modified float) | 15% Maximum Cap |
| Dividend Yield Profile | Relatively High | Moderate | Relatively Low | Moderate |
| Trading Hours (Local) | 09:59:45 – 16:21:30 Sydney | 09:30 – 16:00 ET | 09:30 – 16:00 ET | 09:00 – 17:30 CET |
Common Myths vs. Empirical Facts
- Myth: The All Ordinaries and the ASX 200 are the same index.
- Fact: The All Ordinaries (
XAO) tracks 500 companies by total market capitalization without float adjustment. The S&P/ASX 200 (XJO) is an investable institutional benchmark of the top 200 liquid, float-adjusted companies.
- Fact: The All Ordinaries (
- Myth: The ASX 200 is purely a mining index.
- Fact: While Materials comprise roughly 27.7% of the index, Financials (commercial banks) represent the largest single sector at approximately 32.1%, giving the index significant exposure to domestic mortgage lending alongside natural resources.
- Myth: The headline
XJOreflects the true total return of holding Australian equities.- Fact: The headline
XJOis a Price Return index that excludes dividends. Because Australian stocks offer substantial dividend yields, long-term wealth accumulation is more fully tracked via dividend-reinvested versions such as the S&P/ASX 200 Gross Total Return Index (XJT) and the end-of-day Accumulation Index (XJOA).
- Fact: The headline
- Myth: Stocks on the ASX still open in five alphabetical staggered groups.
- Fact: Effective June 23, 2025, the ASX retired the former five-group alphabetical rotation, replacing it with a modernized single opening-price auction occurring between 9:59 AM and 9:59:15 AM Sydney Time, followed by a levelling phase before continuous matching.
Frequently Asked Questions
What does “ASX” stand for?
ASX stands for the Australian Securities Exchange, the primary public equities and derivatives marketplace in Australia, headquartered in Sydney.
What is the difference between the S&P/ASX 200 and the S&P/ASX 200 Gross Total Return / Accumulation Index?
The S&P/ASX 200 (XJO) is a Price Return index that tracks share price fluctuations without factoring in dividend payouts. The S&P/ASX 200 Gross Total Return Index (XJT) and the end-of-day S&P/ASX 200 Accumulation Index (XJOA) account for the mathematical reinvestment of cash dividend distributions into the index.
Who calculates the ASX 200?
The benchmark is managed, maintained, and calculated by S&P Dow Jones Indices in partnership with the Australian Securities Exchange through the S&P Australian Index Committee.
What are the “Big Four” banks in the ASX 200?
The “Big Four” Australian banks are Commonwealth Bank of Australia (CBA), National Australia Bank (NAB), Westpac Banking Corporation (WBC), and Australia and New Zealand Banking Group (ANZ).
How often does the ASX 200 rebalance?
The index undergoes scheduled quarterly rebalancings in March, June, September, and December to update share counts, adjust Investable Weight Factors (IWF), and replace ineligible constituents based on three-month liquidity and capitalization rankings.
Are franking credits included in the ASX 200 index calculation?
No. Standard index calculations, including the dividend-reinvesting accumulation and total-return versions, account for cash dividend distributions but do not add the value of refundable tax imputation credits (franking credits). Therefore, an Australian resident investor’s after-tax outcome can differ from the reported index return depending on their individual tax position and eligibility for franking credits.
Strategic Summary & Core Takeaways
- Institutional Market Standard: The ASX 200 (
XJO) is Australia’s primary investable benchmark, representing roughly 80% of domestic listed equity capitalization. - Dual-Sector Concentration: The index is concentrated in Financials (32.1%) and Materials (27.7%), functioning simultaneously as a domestic banking gauge and a global industrial commodity proxy.
- Updated Methodology Rules: S&P DJI evaluates eligibility over a three-month period, requiring a 50% relative liquidity hurdle, an explicit 15% minimum IWF for new inclusions, and rank 179/221 addition/deletion buffers.
- Dividends & Total Returns: Australian corporate equities distribute substantial dividend yields; performance comparisons should reference the S&P/ASX 200 Gross Total Return Index (
XJT) or Accumulation Index (XJOA). - Modernized Market Microstructure: Execution features a modernized single opening auction around 9:59 AM Sydney Time (operational since June 23, 2025), continuous matching until 4:00 PM, an institutional closing cross at 4:10 PM–4:11 PM, and a dedicated Post Close session ending at 4:21:30 PM.
Next Reading Suggestions
- USA S&P 500: The Complete Guide to Index Methodology, Market-Cap Weighting, and Global Market Mechanics
- Canada TSX: The Complete Guide to the S&P/TSX Composite Index, Methodology, and Market Structure
- Germany DAX 40: The Complete Guide to Components, Total Return Methodology, and Global Market Mechanics
- Dubai Financial Market (DFM): The Complete Guide to the DFMGI Index, Methodology, and Market Structure
- How Stock Prices Are Determined: Market Microstructure, Supply and Demand, and Valuation
- What Is Market Capitalization? The Complete Guide to Market Cap, Company Size, and Valuation
- Interest Rates and Exchange Rates: The Complete Guide to Global Currency Pricing
- Fed Rate Cuts & Global Liquidity: The Complete Guide to Interest Rates, the Fed Balance Sheet, and Asset Markets
- What Is Gold? The Complete Guide to Real Money, Store of Value & Why It Matters
Author Box & E-E-A-T Verification
Written & Researched By: CurrencyPlans Editorial Research Team
Editorial Review & Methodological Standards: This Australian equity market guide is developed from primary exchange operating rules, quantitative index methodology documentation, and regulatory disclosures. Technical criteria—including S&P Australian Index Committee guidelines, three-month relative liquidity evaluations, 15% minimum Investable Weight Factor (IWF) rules, GICS sector classifications, and modernized single opening auction rules—have been verified against official publications from the Australian Securities Exchange (ASX), S&P Dow Jones Indices, the Australian Securities and Investments Commission (ASIC), and the Reserve Bank of Australia (RBA).
Educational References & Market Data Sources
For official index rulebooks, constituent announcements, and trading schedules, consult primary regulatory and exchange portals directly:
- Australian Securities Exchange (ASX Official Portal): ASX
- S&P Dow Jones Indices (S&P/ASX Australian Indices Methodology): S&P Dow Jones Indices
- Reserve Bank of Australia (RBA Monetary Policy & Financial Stability): Reserve Bank of Australia
- Australian Securities and Investments Commission (ASIC Market Supervision): ASIC
- Australian Prudential Regulation Authority (APRA Bank Supervision): APRA
Educational Disclaimer
This guide is prepared strictly for educational, research, and informational purposes and does not constitute personalized financial, investment, trading, or tax advice. Equities, regional market indices, and derivative contracts carry investment risks. Historical returns of the ASX 200 do not guarantee future investment performance. Always conduct independent research and consult a licensed fiduciary financial advisor before allocating investment capital.

