
Executive Summary & Core Thesis
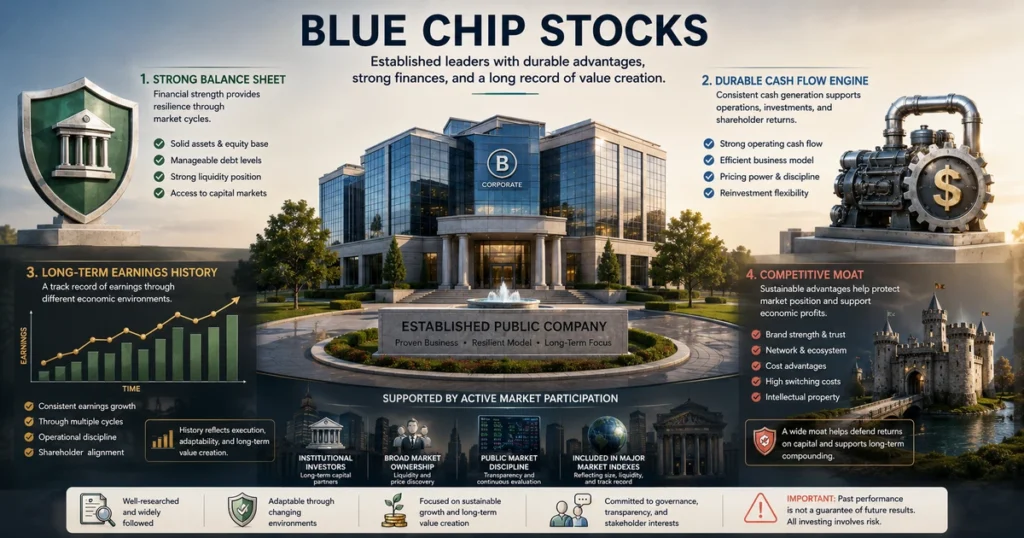
In global capital markets, blue chip stocks generally refer to shares of large, well-established, financially sound companies with long operating histories, durable business models, strong competitive positions, and substantial market presence. Many have demonstrated relatively consistent earnings and cash generation across economic cycles, often possessing long histories of returning capital to shareholders through regular cash dividends and share repurchases.
However, an institutional perspective requires dispelling common market myths: a blue chip designation does not guarantee absolute safety, immunity from economic recessions, or permanent market leadership. Business moats can erode over time, consumer preferences change, and even high-quality corporations can produce substandard investment returns if purchased at excessive valuation multiples. Understanding blue chip stocks requires evaluating corporate competitive advantages, return on invested capital, cash flow durability, dividend sustainability, and broader macroeconomic factors.
The Foundational Definition: What Are Blue Chip Stocks?
Quick Answer: Blue Chip Stocks
Blue chip stocks are shares of large, nationally or internationally recognized companies with long records of stable earnings, durable competitive advantages, and strong financial resilience. These enterprises generally lead their respective industries, maintain solid balance sheets, and frequently return capital to shareholders through dividends or share buybacks. While blue chip stocks may experience less volatility than early-stage or speculative equities, they are not risk-free investments and remain exposed to broad market downturns, operational disruption, and valuation risk over time.
In financial economics and equity analysis, blue chip stocks represent equity ownership in premier, industry-leading corporations. These enterprises are often among the largest and most established companies in their respective markets and may be constituents of major benchmark indexes such as the S&P 500, Dow Jones Industrial Average, FTSE 100, DAX, or NIFTY 50.
To understand how these shares trade and represent fractional equity ownership in an operating business, explore our foundational manual on what stocks are.
+-------------------------------------------------------------------------------+
|                       THE ANATOMY OF A BLUE CHIP ENTERPRISE                   |
+----------------------+-----------------------------+--------------------------+
| CORPORATE PILLAR     | INSTITUTIONAL BENCHMARK     | ECONOMIC PURPOSE         |
+----------------------+-----------------------------+--------------------------+
| Market Footprint     | Large / Mega-Cap Scale      | High institutional depth |
| Balance Sheet Health | Industry-Appropriate Solvency| Supports credit stability|
| Earnings Stability   | Multi-Cycle Operating Profit| Funds self-sustaining ops|
| Cash Flow Generation | Recurring Free Cash Flow    | Powers capital returns   |
| Corporate Moat       | Brand, Patents, Network Eff.| Defends profit margins   |
+----------------------+-----------------------------+--------------------------+
Many mature blue chip companies generate substantial internal operating cash flows that can support capital expenditures, research initiatives, debt obligations, and shareholder distributions, although funding needs and capital structures vary by business and industry.
Historical Origins of the “Blue Chip” Nomenclature
The term “blue chip” is commonly traced to the early 20th century and is widely associated with Oliver Gingold of Dow Jones. The phrase was inspired by higher-value blue poker chips used in card games and was eventually adopted in financial journalism as an informal description for highly regarded, actively traded stocks.
                      ┌─────────────────────────────────────────┐
                      │    HISTORICAL TRADING FLOOR ANALOGY     │
                      │  (Inspired by poker chip denominations  │
                      │   where blue represented highest value) │
                      └────────────────────┬────────────────────┘
                                           │
                         (Informal Wall Street Journalistic Usage)
                                           ▼
                      ┌─────────────────────────────────────────┐
                      │     EARLY FINANCIAL REPORTING ROOTS     │
                      │  (Described high-priced, highly traded  │
                      │   shares of prominent corporations)     │
                      └────────────────────┬────────────────────┘
                                           │
                        (Evolution of Institutional Meaning)
                                           ▼
                      ┌─────────────────────────────────────────┐
                      │     MODERN FINANCIAL ECONOMICS USAGE    │
                      │  (Describes quality, financial scale,   │
                      │   solvency, and competitive durability) │
                      └─────────────────────────────────────────┘
Over time, its meaning shifted away from nominal share price and toward corporate quality, financial strength, scale, and established market position. Today, nominal share price alone does not define a blue chip; rather, the classification reflects an enterprise’s balance sheet durability, competitive moat, and operational scale.
Core Defining Characteristics of a Blue Chip Company
Quick Answer: Defining Traits
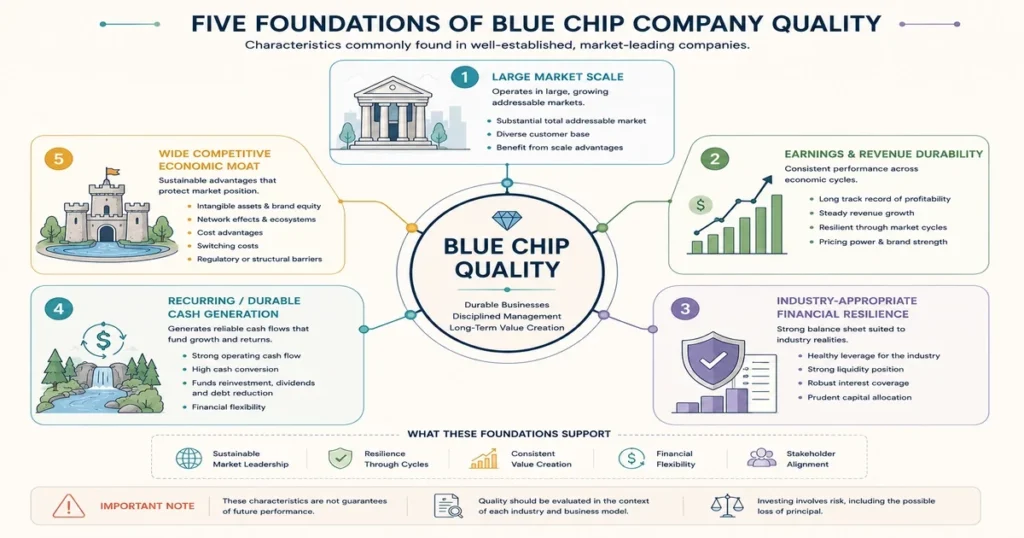
Blue chip companies are characterized by large market capitalization, multi-cycle profitability, disciplined debt management, and durable competitive moats. They typically maintain prominent market share in their industries, generate consistent operating cash flows, and possess established capital allocation frameworks that support ongoing reinvestment, financial stability, and long-term shareholder distributions through varying economic conditions.
While there is no formal statutory definition or single regulatory checklist that designates a company as a “blue chip,” institutional investors evaluate these enterprises through several complementary structural attributes:
| Quality Indicator | Analytical Metric | Institutional Expectation |
|---|---|---|
| Market Scale | Total Market Capitalization | Typically classified within large-cap or mega-cap market tiers |
| Earnings Track Record | Multi-Year Net Income | Profitable operations sustained across multiple economic phases |
| Balance Sheet Leverage | Net Debt to EBITDA & Coverage | Moderate debt levels appropriate to business cyclicality and capital intensity |
| Return on Capital | Return on Invested Capital (ROIC) | Often demonstrates the ability to generate returns above the corporate cost of capital across business cycles |
| Capital Allocation | Reinvestment, Dividends &/or Buybacks | Disciplined allocation of recurring cash flow according to business needs |
                      ┌─────────────────────────────────────────┐
                      │        THE BLUE CHIP QUALITY VAULT      │
                      └────────────────────┬────────────────────┘
                                           │
         ┌─────────────────────────────────┼─────────────────────────────────┐
         │                                 │                                 │
         ▼                                 ▼                                 ▼
┌──────────────────┐             ┌──────────────────┐             ┌──────────────────┐
│ FINANCIAL SCALE  │             │ CASH DURABILITY  │             │ MARKET MOAT      │
├──────────────────┤             ├──────────────────┤             ├──────────────────┤
│ Large Market Cap │             │ Durable Earnings │             │ Pricing Power    │
│ Financial        │             │ Recurring /      │             │ High Barriers to │
│ Stability        │             │ Durable Cash Flow│             │ Competitor Entry │
└──────────────────┘             └──────────────────┘             └──────────────────┘
These structural characteristics are what make blue chip shares standard components of major exchange order books, as detailed in our guide on what a stock exchange is.
Blue Chip vs. Growth vs. Value Stocks: Structural Taxonomy
Quick Answer: Taxonomy Differences
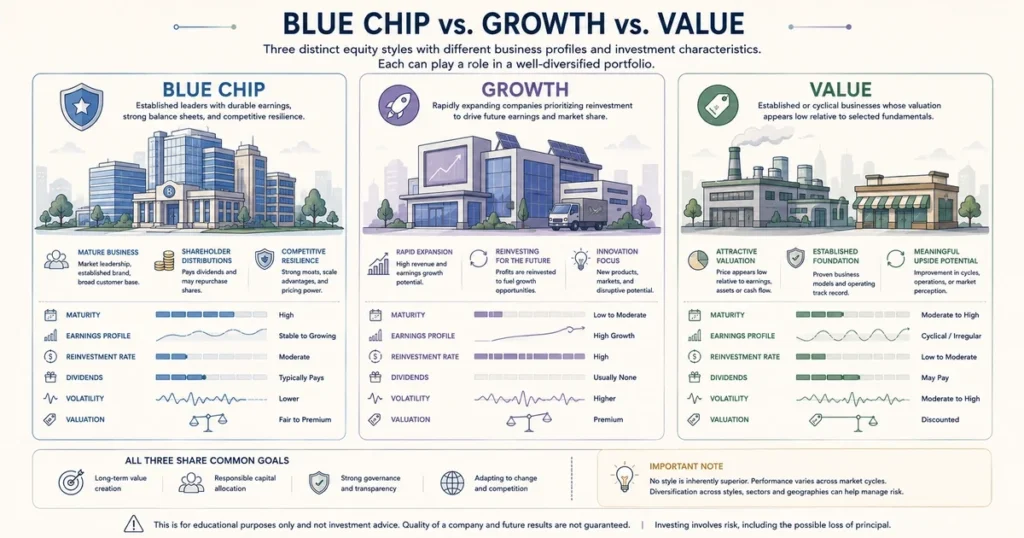
Blue chip stocks represent established market leaders balancing consistent profitability, balance sheet resilience, and capital returns. In contrast, pure growth stocks prioritize rapid revenue expansion and market capture—often reinvesting heavily in the business—while value stocks are generally identified by valuations that appear low relative to fundamentals such as earnings, cash flows, book value, or other measures of estimated intrinsic value.
To build an efficient portfolio, investors should recognize how blue chip companies differ from early-stage growth or deep value securities:
+------------------------------------------------------------------------------------------------+
|                         EQUITY TAXONOMY & STRATEGIC COMPARISON                         |
+----------------------+-----------------------------+--------------------------+--------------------------+
| STRATEGIC ATTRIBUTE  | BLUE CHIP EQUITIES          | GROWTH STOCKS            | VALUE STOCKS             |
+----------------------+-----------------------------+--------------------------+--------------------------+
| Business Maturity    | Generally mature and        | Often scaling or         | Often mature, cyclical,  |
|                      | established                | expanding rapidly        | or temporarily out of   |
|                      |                             |                          | favor                    |
+----------------------+-----------------------------+--------------------------+--------------------------+
| Revenue Expansion    | Generally more established | Often higher expected    | Usually moderate or      |
|                      | growth profile             | growth, but varies widely| uneven growth expectations|
+----------------------+-----------------------------+--------------------------+--------------------------+
| Profitability        | Generally established and  | Can range from pre-profit| Often established, but   |
|                      | profitable                 | to highly profitable     | varies by sector and cycle|
+----------------------+-----------------------------+--------------------------+--------------------------+
| Free Cash Flow (FCF) | Often substantial and      | Frequently reinvested    | Can be substantial but   |
|                      | recurring                  | heavily                  | varies by business cycle |
+----------------------+-----------------------------+--------------------------+
| Capital Return       | May include dividends      | Often prioritizes        | May include dividends    |
|                      | and/or buybacks            | reinvestment             | and/or buybacks           |
+----------------------+-----------------------------+--------------------------+
| Valuation             | Can range from discounted | Often reflects higher    | Often appears relatively |
|                      | to premium                 | growth expectations      | low versus selected      |
|                      |                             |                          | fundamentals             |
+----------------------+-----------------------------+--------------------------+
| Downside Volatility  | May be lower than many     | Can be higher depending  | Can be elevated when the |
|                      | speculative equities       | on expectations and      | underlying business or   |
|                      |                             | valuation                | sector is under pressure |
+----------------------+-----------------------------+--------------------------+
The Overlap Between Categories
A blue chip company is not strictly isolated from growth or value frameworks:
- Growth Blue Chips: Large, established technology or consumer leaders that maintain robust balance sheets while continuing to expand revenues at attractive rates.
- Value Blue Chips: Established industrial, financial, or consumer staple enterprises that trade at modest valuation multiples while offering potentially attractive shareholder returns.
The Anatomy of an Economic Moat: How Blue Chips Defend Market Share
Quick Answer: Economic Moats
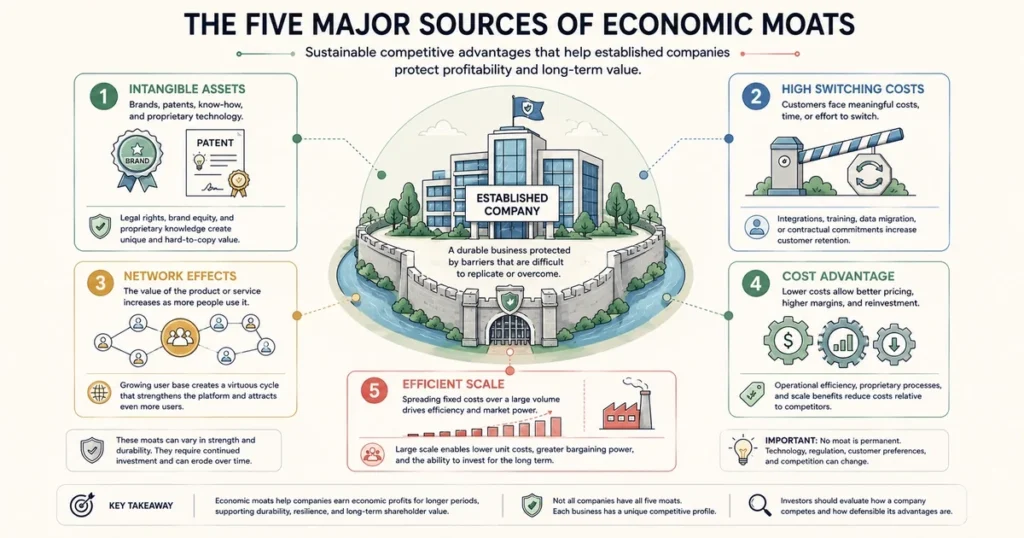
An economic moat is a sustainable competitive advantage that allows a corporation to protect its market share, pricing power, and profit margins from competitor erosion over time. The five primary moat sources include intangible assets (brands and patents), switching costs, network effects, cost advantages, and efficient scale. Durable moats prevent high industry returns from being quickly eroded by new entrants.
In capital-market economics, high returns on invested capital naturally attract competing capital. Without structural defenses, competitors enter the market, undercut pricing, and compress industry margins. Durable economic advantages can help established companies defend market share, pricing power, and profitability over time, although no competitive advantage is permanent.
                      ┌─────────────────────────────────────────┐
                      │    CORPORATE REVENUES & PROFIT POOL     │
                      └────────────────────┬────────────────────┘
                                           │
                        (Protected by Structural Moat Levers)
                                           ▼
         ┌─────────────────────────────────┴─────────────────────────────────┐
         │                                                                   │
         ▼                                                                   ▼
┌──────────────────────────────────┐               ┌──────────────────────────────────┐
│        INTANGIBLE ASSETS         │               │         SWITCHING COSTS          │
│  (Iconic brands, patents,        │               │  (High technical or operational │
│   exclusive regulatory licenses) │               │   friction to change vendors)   │
└──────────────────────────────────┘               └──────────────────────────────────┘
         │                                                                   │
         ▼                                                                   ▼
┌──────────────────────────────────┐               ┌──────────────────────────────────┐
│         NETWORK EFFECTS          │               │         COST ADVANTAGES          │
│  (Product value increases as     │               │  (Unmatched supply-chain scale, │
│   total user base expands)       │               │   proprietary manufacturing)    │
└──────────────────────────────────┘               └──────────────────────────────────┘
                                           │
                                           ▼
                              ┌──────────────────────────┐
                              │      EFFICIENT SCALE     │
                              │ (Limited market demand  │
                              │  supports only a small   │
                              │  number of efficient     │
                              │  competitors)            │
                              └──────────────────────────┘
The Five Primary Sources of Economic Moats:
- Intangible Assets (Brands, Patents, and Licenses): Established brand equity allows companies to maintain pricing power, while intellectual property patents provide legal protection for proprietary innovations over multi-year periods.
- High Switching Costs: When an enterprise customer embeds a specific software system, manufacturing component, or operational standard, the cost, operational risk, and downtime required to switch to a competitor become significant deterrents.
- Network Effects: A product or service becomes progressively more valuable to existing participants as new users join the network (such as global payment processing rails and digital marketplaces).
- Cost Advantages: Substantial operational scale, proprietary distribution channels, or advantageous resource access allow certain firms to produce goods and services at lower unit costs than competitors.
- Efficient Scale: In specialized industries with limited natural demand (such as specific freight corridors or regulated infrastructure), the market is fully served by existing operators, making new competitor entry economically inefficient.
Balance Sheet Health, Solvency, and Free Cash Flow Durability
A strong balance sheet is an important characteristic commonly associated with blue chip companies, although financial strength varies across industries and business models. When macroeconomic slowdowns occur or central banks adjust policy rates, resilient balance sheets help companies absorb shocks without financial distress.
To understand how broader monetary policies influence corporate borrowing costs, review our analysis on interest rates and exchange rates.
                  ┌─────────────────────────────────────────┐
                  │          OPERATING CASH FLOW            │
                  └────────────────────┬────────────────────┘
                                       │
                          (Less: Capital Expenditures)
                                       ▼
                  ┌─────────────────────────────────────────┐
                  │             FREE CASH FLOW              │
                  │       (Operating Cash Flow − CapEx)     │
                  └────────────────────┬────────────────────┘
                                       │
                 ┌─────────────────────┴─────────────────────┐
                 │                                           │
                 ▼                                           ▼
        ┌──────────────────┐                       ┌──────────────────┐
        │ DEBT SERVICE &   │                       │ CAPITAL RETURNS  │
        │ SOLVENCY SUPPORT │                       │ & REINVESTMENT   │
        └──────────────────┘                       └──────────────────┘
Core Balance Sheet Metrics Evaluated by Institutional Analysts:
- Interest Coverage Ratio: Calculated as Operating Income (EBIT) divided by annual interest expense. Higher coverage generally indicates greater capacity to service interest obligations, but appropriate levels vary substantially by industry, business model, and economic cycle.
- Net Debt to EBITDA: Compares net debt ($\text{Total Debt} – \text{Cash}$) with operating EBITDA to provide a broad indication of financial leverage. Lower leverage can provide greater financial flexibility, but appropriate levels vary significantly by industry, business model, capital intensity, and economic conditions.
- Free Cash Flow Conversion: Compares free cash flow with reported net income ($\frac{\text{Free Cash Flow}}{\text{Net Income}} \times 100$). A consistently strong conversion ratio can provide useful evidence that reported earnings are translating into cash generation, but the ratio can be distorted when net income is unusually low or negative, and individual periods can be affected by working-capital movements, capital expenditures, and other timing effects.
The Role of Dividends: Dividend Aristocrats, Kings, and Coverage Metrics
Quick Answer: Blue Chip Dividends
Cash dividends are distributions declared by corporate boards and paid to eligible shareholders. The S&P 500 Dividend Aristocrats are companies that have increased dividends for at least 25 consecutive years, while Dividend Kings is an informal market term commonly used for companies with 50 or more consecutive years of dividend increases. Investors can evaluate dividend sustainability using earnings and free cash flow payout ratios, while also considering debt obligations, business cyclicality, liquidity, and future investment needs.
Cash dividends are distributions declared by a company and paid to eligible shareholders. Mature, cash-generative companies may return capital through dividends, share repurchases, or a combination of both.
+-------------------------------------------------------------------------------+
|                       DIVIDEND CLASSIFICATIONS & DESCRIPTIONS                 |
+----------------------+-----------------------------+--------------------------+
| CLASSIFICATION TIER  | GENERAL CONSECUTIVE CRITERIA| METHODOLOGICAL OVERVIEW  |
+----------------------+-----------------------------+--------------------------+
| Dividend Kings       | 50+ Consecutive Years       | Informal market term for |
|                      |                             | elite multi-decade growth|
+----------------------+-----------------------------+--------------------------+
| S&P 500 Dividend     | 25+ Consecutive Years       | S&P 500 index members    |
| Aristocrats          |                             | meeting formal rules     |
+----------------------+-----------------------------+--------------------------+
| Dividend Achievers   | Methodology-dependent       | Eligibility criteria     |
|                      |                             | vary by index provider   |
+----------------------+-----------------------------+--------------------------+
Evaluating Dividend Sustainability
Dividend sustainability should be evaluated alongside earnings stability, free cash flow, capital expenditure requirements, debt obligations, business cyclicality, and the company’s long-term capital-allocation policy. No single payout-ratio range guarantees dividend sustainability across all industries.
- Earnings Payout Ratio:
$$\text{Dividend Payout Ratio} = \left( \frac{\text{Total Annual Dividends Paid}}{\text{Net Income}} \right) \times 100$$
- Free Cash Flow Payout Ratio:
$$\text{FCF Payout Ratio} = \left( \frac{\text{Total Annual Dividends Paid}}{\text{Free Cash Flow}} \right) \times 100$$
Comparing cash distributions with free cash flow can help investors assess whether dividends are supported by internally generated cash after capital expenditures, although sustainability also depends on debt obligations, business cyclicality, liquidity, and future investment needs.
The Valuation Fallacy: Why High Quality Does Not Equal Automatic Safety
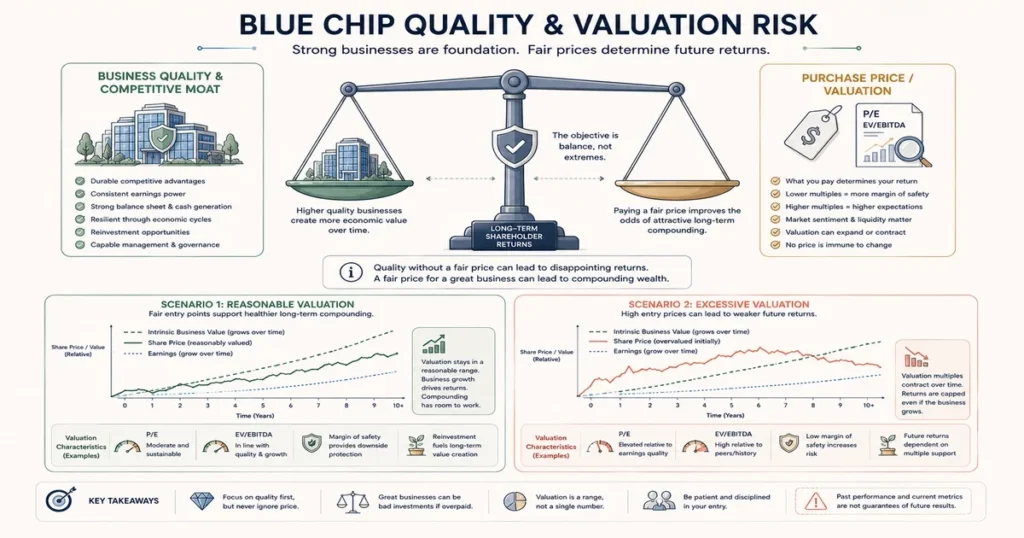
Quick Answer: Valuation Risk
Assuming that a blue chip company is automatically a safe investment regardless of purchase price is a major financial misconception. Even an exceptional corporation with an unassailable economic moat can deliver poor long-term investment returns if acquired at an excessively high valuation multiple that later contracts. Investment outcomes depend on both business execution and the price paid relative to underlying cash flows.
One of the most common investor misconceptions is confusing business quality with investment return. A corporation can be an unquestioned market leader with strong financials, but if an investor pays an excessive price for its shares, long-term returns will be compressed.
To understand how market supply, order books, and earnings expectations establish these valuations, consult our guide on how stock prices are determined.
                      ┌─────────────────────────────────────────┐
                      │    EXCELLENT BLUE CHIP BUSINESS QUALITY │
                      │  (Steady underlying annual profit growth│
                      └────────────────────┬────────────────────┘
                                           │
         ┌─────────────────────────────────┴─────────────────────────────────┐
         │                                                                   │
         ▼ (Scenario A: Purchased at Reasonable Valuation)                   ▼ (Scenario B: Purchased at Speculative Multiple)
┌──────────────────────────────────┐               ┌──────────────────────────────────┐
│ MODERATE VALUATION MULTIPLE      │               │ HIGHLY ELEVATED VALUATION        │
├──────────────────────────────────┤               ├──────────────────────────────────┤
│ * Valuation multiple remains     │               │ * Valuation multiple contracts   │
│   broadly stable over time       │               │   substantially over holding period|
│ * Earnings growth contributes    │               │ * Multiple contraction offsets   │
│   positively to long-term returns│               │   part or all of earnings growth │
│ * Dividends add to total return  │               │ * Dividends provide partial yield│
│ * OUTCOME: Potentially strong    │               │ * OUTCOME: Potentially muted or  │
│   long-term total shareholder ret│               │   negative long-term total return│
└──────────────────────────────────┘               └──────────────────────────────────┘
The historical Nifty Fifty episode in the United States illustrates the danger of paying exceptionally high valuation multiples for companies considered unusually high quality. Even when underlying businesses remain viable and grow over time, substantial multiple compression can produce disappointing long-term shareholder returns.
Representative Examples Across Major Global Stock Exchanges
While constituent memberships shift over time based on market capitalization and industry disruption, prominent examples of blue chip enterprises across major international exchanges include:
| Geographic Region | Representative Exchange | Illustrative Blue Chip Companies | Primary Industry Sectors |
| United States | NYSE & NASDAQ | Microsoft, Apple, Johnson & Johnson, Procter & Gamble, JPMorgan Chase | Technology, Healthcare, Consumer Staples, Banking |
| United Kingdom | London Stock Exchange (LSE) | AstraZeneca, Shell, Unilever, HSBC Holdings, Diageo | Pharmaceuticals, Energy, Consumer Goods, Financials, Beverages |
| Europe (Eurozone) | Euronext / DAX | ASML Holding, LVMH, SAP, Siemens | Semiconductors, Luxury, Enterprise Software, Industrials |
| Switzerland | Swiss Exchange (SIX) | Nestlé | Consumer Staples / Food |
| Japan | Tokyo Stock Exchange (TSE) | Toyota Motor, Sony Group, Keyence, Mitsubishi UFJ Financial | Automotive, Consumer Technology & Media, Automation, Banking |
| India | National Stock Exchange (NSE) | Reliance Industries, Tata Consultancy Services, HDFC Bank, Infosys | Diversified Conglomerate, IT Services, Banking & Financials |
Note: Company names are provided strictly for illustrative educational taxonomy and do not constitute investment advice or recommendations.
Evaluating Blue Chip Companies: A Step-by-Step Investor Checklist
Quick Answer: Analysis Checklist
When evaluating blue chip stocks, follow a disciplined five-step checklist: verify multi-cycle profitability history, assess competitive moat durability, review balance sheet leverage and debt maturity profiles relative to industry peers, assess recurring free cash flow and capital-allocation capacity while evaluating dividend coverage when dividends are paid, and analyze valuation multiples against historical industry baselines to avoid overpayment.
Investors evaluating an individual company for blue chip characteristics should apply a structured five-stage assessment framework:
                  ┌─────────────────────────────────────────┐
                  │   STAGE 1: MULTI-CYCLE EARNINGS AUDIT   │
                  │  (Verify operating profitability through│
                  │   varying macroeconomic phases)         │
                  └────────────────────┬────────────────────┘
                                       │
                                       ▼
                  ┌─────────────────────────────────────────┐
                  │   STAGE 2: ECONOMIC MOAT ASSESSMENT     │
                  │  (Evaluate pricing power, brand equity, │
                  │   switching costs, and market position) │
                  └────────────────────┬────────────────────┘
                                       │
                                       ▼
                  ┌─────────────────────────────────────────┐
                  │   STAGE 3: BALANCE SHEET SOLVENCY       │
                  │  (Review interest coverage, leverage,   │
                  │   liquidity, and debt maturity profile) │
                  └────────────────────┬────────────────────┘
                                       │
                                       ▼
                  ┌─────────────────────────────────────────┐
                  │  STAGE 4: CASH FLOW & DIVIDEND CHECK    │
                  │  (Assess recurring free cash flow and   │
                  │   dividend coverage where applicable)   │
                  └────────────────────┬────────────────────┘
                                       │
                                       ▼
                  ┌─────────────────────────────────────────┐
                  │   STAGE 5: VALUATION MULTIPLE REVIEW    │
                  │  (Compare P/E, EV/EBITDA, and cash flow │
                  │   yields to historical sector medians)  │
                  └─────────────────────────────────────────┘
For a comprehensive guide on opening accounts, placing orders, and structuring long-term portfolios, explore our complete tutorial on how to invest in stocks.
Portfolio Implementation: Direct Stock Selection vs. Blue Chip ETFs
Investors allocate capital toward blue chip equities through two primary portfolio implementation approaches:
| Implementation Vehicle | Primary Advantages | Key Analytical Considerations |
| Direct Stock Selection | Greater control over individual security selection and portfolio weights; no fund expense ratio | Requires continuous financial analysis; higher potential company-specific concentration risk |
| Blue Chip Focused ETFs / Funds | Instant diversification across established companies; passive automated rebalancing; minimal maintenance | Ongoing fund expense ratios; index methodology determines constituent selection and weighting |
| Broad-Market Index Funds | Broad exposure capturing established blue chips alongside mid- and large-cap growth leaders | Market-cap weighting can lead to sector or mega-cap concentration during certain cycles |
                      ┌─────────────────────────────────────────┐
                      │        BLUE CHIP ALLOCATION PATHWAY     │
                      └────────────────────┬────────────────────┘
                                           │
         ┌─────────────────────────────────┴─────────────────────────────────┐
         │                                                                   │
         ▼                                                                   ▼
┌──────────────────────────────────┐               ┌──────────────────────────────────┐
│     DIRECT STOCK SELECTION       │               │      POOLED INDEX ETFS / FUNDS   │
│  (Holding a diversified selection│               │  (Broad-market or blue-chip ETFs │
│   of researched blue chip firms) │               │   tracking equity indexes)       │
├──────────────────────────────────┤               ├──────────────────────────────────┤
│ * Customized security selection  │               │ * Automated diversification      │
│ * No fund expense ratio          │               │ * Instant single-trade execution │
│ * Direct voting governance       │               │ * Low maintenance requirement    │
└──────────────────────────────────┘               └──────────────────────────────────┘
Systemic Vulnerabilities, Downside Risks, and Creative Destruction
Quick Answer: Blue Chip Risks
Blue chip companies face significant long-term risks, including creative destruction from technological disruption, bureaucratic inertia that slows operational adaptation, poor capital allocation through overpriced acquisitions, and systemic macroeconomic shocks. No company possesses a permanent competitive advantage, and historical market leadership does not prevent eventual corporate decline or obsolescence.
A blue chip designation is not permanent. Capitalism is characterized by creative destruction—the continuous process by which technological innovation, shifting consumer habits, and agile competitors disrupt established market leaders.
                      ┌─────────────────────────────────────────┐
                      │     THE LIFECYCLE RISKS OF BLUE CHIPS   │
                      └────────────────────┬────────────────────┘
                                           │
         ┌─────────────────────────────────┼─────────────────────────────────┐
         │                                 │                                 │
         ▼                                 ▼                                 ▼
┌──────────────────┐             ┌──────────────────┐             ┌──────────────────┐
│ DISRUPTIVE TECH  │             │ CAPITAL ALLOCATION│            │ REGULATORY RISK  │
├──────────────────┤             ├──────────────────┤             ├──────────────────┤
│ New innovations  │             │ Unproductive debt-│            │ Antitrust actions│
│ render legacy    │             │ financed mergers  │            │ and structural   │
│ moats obsolete   │             │ impair balance sh.│            │ compliance costs │
└──────────────────┘             └──────────────────┘             └──────────────────┘
Notable Examples of Long-Term Blue Chip Disruption:
- Eastman Kodak: Once an iconic blue chip corporation with substantial global market share in photography, Kodak pioneered digital imaging technology but struggled to transition its legacy chemical-film revenue model in time, eventually entering restructuring.
- General Electric: A foundational industrial conglomerate for over a century, GE expanded heavily into financial services (GE Capital), leading to significant balance sheet challenges during the 2008 financial crisis, subsequent dividend reductions, asset divestitures, and restructuring.
- Sears, Roebuck and Co.: The dominant American retail leader for much of the 20th century, Sears lost market share as consumer preferences shifted toward big-box retailers and modern digital commerce channels.
Frequently Asked Questions (Institutional FAQ)
What is the simplest definition of a blue chip stock?
A blue chip stock is a share of ownership in a large, well-established, and financially sound public corporation with a proven operating history, stable earnings, strong balance sheet health, and market leadership in its sector.
Are blue chip stocks guaranteed to be safe and profitable?
No. All equity investments carry capital risk. While blue chip companies may experience less volatility than early-stage or speculative equities, volatility varies substantially by company, sector, valuation, and market conditions. Furthermore, company-specific moats can erode over time due to competitive disruption.
Do all blue chip companies pay cash dividends?
While many mature blue chip corporations have long histories of paying cash dividends, dividend distributions are not a universal requirement. Certain mega-cap leaders classified as modern blue chips retain a larger share of operating cash flow for research and development or return capital primarily through share buybacks.
What is the difference between a blue chip stock and a penny stock?
Blue chip stocks generally represent shares of large, established companies with substantial liquidity, audited public disclosures, and long operating histories. Penny stocks generally refer to very low-priced securities and can involve lower liquidity, more limited public information, higher volatility, and greater operational or issuer-specific risks depending on the security and trading venue.
Can a blue chip stock ever lose its status or go bankrupt?
Yes. Blue chip status is an informal market description, not a permanent legal title. Disruptive technology, shifting consumer preferences, excessive financial leverage, or poor capital allocation can cause established industry leaders to lose their competitive advantages and experience severe operational decline.
Strategic Summary & Institutional Takeaways
Understanding what blue chip stocks are provides a foundational framework for constructing disciplined, long-term equity investment portfolios.
Blue chip enterprises represent established components of global capital markets. By maintaining durable economic moats, disciplined balance sheets, and consistent cash flow generation, these companies convert economic productivity into shareholder value over multi-year horizons.
However, disciplined investing requires avoiding the assumption that corporate quality automatically guarantees investment safety. By analyzing competitive advantages, evaluating balance sheet solvency, monitoring free cash flow dividend coverage, respecting valuation multiples, and maintaining broad portfolio diversification, investors can incorporate blue chip equities effectively across changing macroeconomic cycles.
Next Reading Suggestions
- What Are Stocks? The Complete Guide to Shares, Equity, and Ownership
- How to Invest in Stocks: The Complete Step-by-Step Guide for Beginners and Long-Term Investors
- What Is the Stock Market? How Global Equity Markets Work and Allocate Capital
- What Is a Stock Exchange? How Exchanges Work, Trade Stocks, and Settle Transactions
- How Stock Prices Are Determined: Market Microstructure, Supply and Demand, and Valuation
- Stock Market History: The Evolution of Global Equity Markets and Capital Systems
Author Box & E-E-A-T Verification
Written By: CurrencyPlans Financial Research Team
Fact-Checked & Reviewed By: Financial Research Team & Equity Editorial Board
Editorial Integrity & Research Standards: CurrencyPlans publishes educational research grounded in established corporate-finance principles, financial economics, and publicly available regulatory and institutional resources. All capital market taxonomy, corporate governance frameworks, balance sheet solvency metrics, and valuation models are cross-referenced with primary multilateral institutions and securities regulatory frameworks, including the US Securities and Exchange Commission (SEC), the Financial Industry Regulatory Authority (FINRA), and the World Federation of Exchanges (WFE).
Primary Institutional References & Regulatory Resources
For official investor education, market regulation standards, and statutory consumer protection rules, consult primary institutional sources directly:
- Investor Education & Asset Protection Guidelines: US Securities and Exchange Commission (SEC) – Investor.gov
- Broker Verification & Market Conduct Rules: Financial Industry Regulatory Authority (FINRA) – BrokerCheck
- Global Securities Exchanges Architecture & Data: World Federation of Exchanges (WFE)
- International Financial Stability & Capital Market Research: Bank for International Settlements (BIS)
- Global Macroeconomic Statistics & Capital Flow Data: International Monetary Fund (IMF) Data Portal
Educational Disclaimer
This guide is prepared strictly for educational, informational, and research purposes and does not constitute personalized financial, investment, legal, or tax advice. Equities and capital market instruments carry inherent risk of capital loss, price volatility, and business failure. Past performance does not guarantee future results. Always perform independent due diligence and consult a licensed, fiduciary financial advisor before making investment commitments.

