

Introduction
The USA S&P 500 (Standard & Poor’s 500) stands as the primary benchmark for institutional capital allocation and corporate equity performance worldwide. Maintained and administered by S&P Dow Jones Indices, the index tracks 500 leading publicly listed large-cap corporations across the United States, representing approximately 80% of total available domestic equity market capitalization. Widely recognized as the definitive proxy for the broad American economy, the S&P 500 serves as the foundational anchor for trillions of dollars in global pension funds, sovereign wealth portfolios, and exchange-traded products.
Unlike the historic price-weighted Dow Jones Industrial Average or unweighted domestic market aggregations, the S&P 500 employs a float-adjusted market capitalization methodology, ensuring constituent weightings strictly reflect publicly accessible shares. Governed by a dedicated U.S. Index Committee rather than an unconstrained automated formula, inclusion demands rigorous quantitative thresholds—including positive aggregate GAAP earnings across the four most recent quarters, substantial market liquidity, and strict financial reporting compliance. As a baseline for global equity risk appetite, understanding the mechanical structure, rebalancing cycles, macroeconomic sensitivity, and derivative ecosystem of the S&P 500 is fundamental to navigating institutional finance.
Executive Summary: The Barometer of American Capitalism
Quick Answer: What Is the USA S&P 500?
The USA S&P 500 is a float-adjusted market-capitalization-weighted index comprising 500 leading large-cap companies listed on eligible U.S. exchanges. Overseen by the S&P Dow Jones Indices U.S. Index Committee, it covers approximately 80% of available U.S. equity market capitalization. The standard headline S&P 500 (
SPX) is calculated as a Price Return Index, meaning constituent share price performance is tracked without incorporating dividend payments into the headline quote.
Launched in its modern 500-stock format on March 4, 1957, the S&P 500 superseded narrow industrial averages by capturing diverse sectors across the broader corporate landscape. By requiring companies to meet ongoing financial stability and liquidity standards, the index operates not merely as a list of the 500 largest businesses by raw market valuation, but as an investable portfolio of established industry leaders, as explored in our foundational manual on how stock prices are determined.
Institutional allocators track the benchmark through three distinct calculation variations:
- Price Return (SPX): The standard headline index that calculates purely the change in equity market values, dropping proportionally when constituent shares trade ex-dividend.
- Total Return (SPTR): An institutional variant that mathematically reinvests all gross cash dividends distributed by component companies back into the index calculation.
- Net Total Return (SPTRN): An operational calculation tracking performance after deducting applicable withholding taxes on dividend distributions, commonly utilized by cross-border international asset managers.
The Structural Evolution: From Historical Roots to Modern Dominance
Quick Answer: How Was the S&P 500 Created?
The origins of the index trace back to 1923, when Standard & Poor’s predecessor introduced an index tracking 233 companies across 26 industries. The index was later reformulated into the 90-stock Composite Stock Index, before evolving into the modern S&P 500 on March 4, 1957, which introduced computerized real-time calculation and established the modern standard for broad market tracking.
The development of the S&P 500 mirrors the technological and operational modernization of American financial markets:
- 1923 (Composite Foundation): Introduction of the initial statistical index tracking 233 companies across 26 industries, paving the way for quantitative multi-sector portfolio analysis.
- March 4, 1957 (The 500-Stock Era): Launch of the official Standard & Poor’s 500 composite, dividing coverage among 425 industrials, 60 utilities, and 15 railroads.
- July 1976 (Financial Sector Integration): Structural revision allowing commercial banks, diversified financial firms, and insurance underwriters into the core roster.
- April 1982 (S&P 500 Futures): The Chicago Mercantile Exchange launches S&P 500 futures, creating a major institutional vehicle for index hedging and synthetic market exposure.
- January 1993 (The First US ETF): State Street Global Advisors debuts the SPDR S&P 500 ETF Trust (
SPY), creating the modern exchange-traded fund landscape. - September 1997 (E-mini Revolution): CME launches the electronic E-mini S&P 500 futures contract, providing a smaller contract format and expanding access to electronic index futures trading.
- 2005 (Float-Adjustment Transition): Shift from gross shares outstanding to float-adjusted market capitalization, ensuring share blocks held by insiders and governments do not distort weights.
Eligibility & Inclusion Criteria: The U.S. Index Committee Rules
Quick Answer: What Does It Take for a Company to Join the S&P 500?
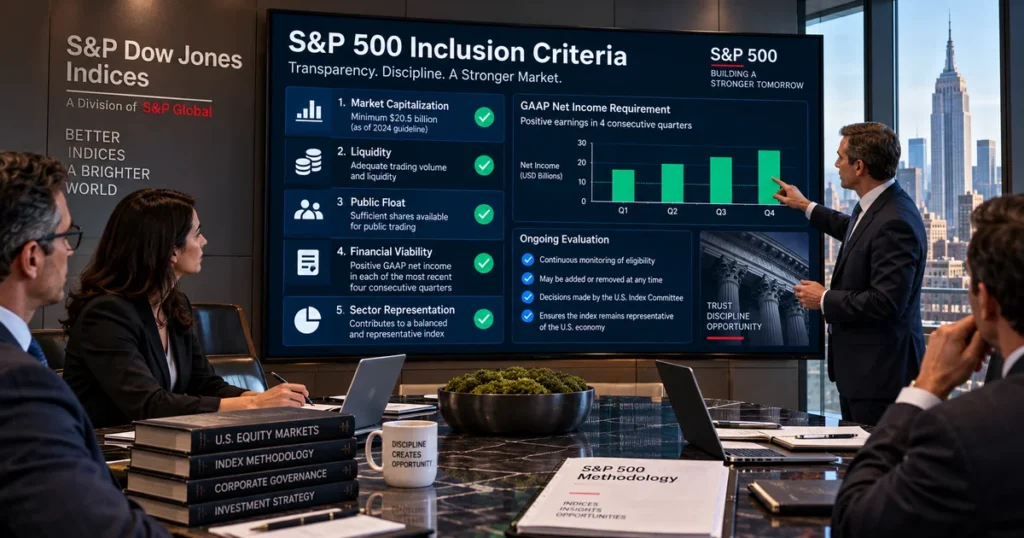
Inclusion in the S&P 500 is not automatic based solely on market capitalization. Candidate corporations must satisfy strict quantitative criteria evaluated by the S&P Dow Jones Indices U.S. Index Committee, including an unadjusted market cap minimum, ongoing trading liquidity, public float availability, and cumulative profitability under US GAAP standards.
Unlike passive quantitative rules that mechanically swap constituents based strictly on capitalization rankings, the S&P 500 utilizes an expert committee that balances turnover costs against market representation.
Key Addition Eligibility Criteria:
These criteria primarily govern consideration for new additions; existing constituents are not automatically removed whenever they fall below an addition threshold, because the Index Committee also considers index continuity, representativeness, and turnover:
- Unadjusted Market Capitalization Minimum: Candidate companies must meet an absolute market capitalization threshold set periodically by the committee (routinely updated to reflect market inflation and broad large-cap valuations).
- Cumulative GAAP Profitability: For most candidate companies, the sum of the most recent four consecutive quarters of reported GAAP earnings must be positive, as must the most recent quarter. For equity REITs, the methodology also permits consideration of Funds From Operations (FFO), where reported.
- Market Liquidity & Turnover: The float-adjusted liquidity ratio (FALR), calculated as annual dollar value traded divided by float-adjusted market capitalization, must be at least 0.75 for additions to the S&P Composite 1500, including the S&P 500, and the stock must trade a minimum of 250,000 shares in each of the six months leading up to the evaluation date, subject to the applicable methodology provisions.
- Investable Public Float: Candidate companies must have an Investable Weight Factor (IWF) of at least 0.10 to be eligible for addition to the S&P U.S. Indices, subject to the methodology’s other applicable eligibility requirements. The IWF represents the proportion of a company’s shares considered available to public investors.
- Corporate Structure & U.S. Domicile: Eligible companies must satisfy the methodology’s requirements for U.S. domicile and eligible security structure, including applicable U.S. reporting and exchange-listing requirements. The domicile assessment considers factors such as incorporation, operational headquarters, exchange listing, and the geographic distribution of assets and revenues. Closed-end funds, business development companies (BDCs), limited partnerships, and American Depositary Receipts (ADRs) are excluded.
Index Weighting Architecture: Float-Adjusted Market Capitalization
Quick Answer: How Are Constituent Weights Calculated?
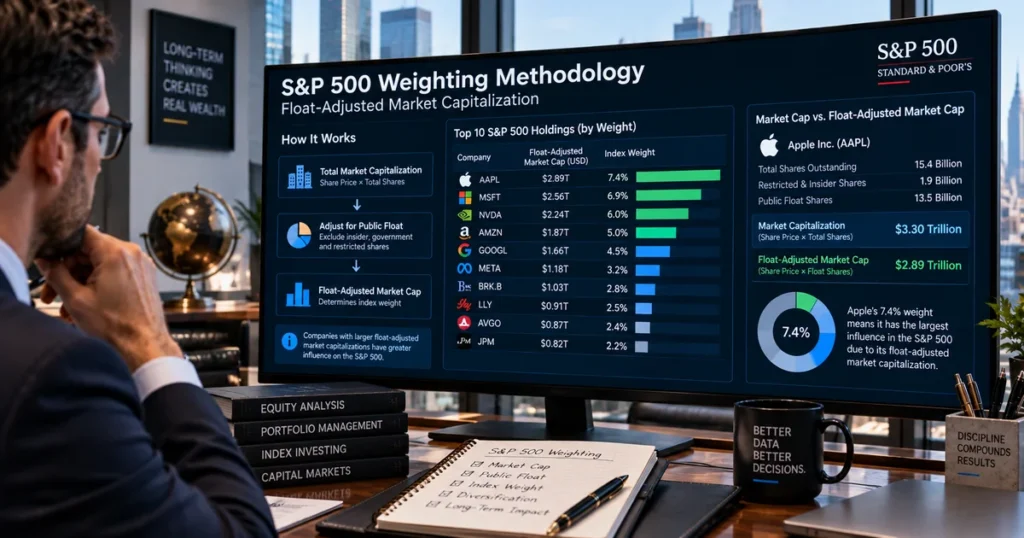
The S&P 500 is weighted by float-adjusted market capitalization, meaning each company’s weight is proportional to the total dollar value of its shares available for public trading, rather than its gross shares outstanding or share price, as detailed in our guide on what market capitalization is.
The mathematical weight of any individual constituent is derived using the following structure:
$$\text{Weight}_i = \frac{P_i \times Q_i \times \text{IWF}_i}{\sum_{k=1}^{N} (P_k \times Q_k \times \text{IWF}_k)}$$
Where:
- $P_i$ is the current market share price of company $i$.
- $Q_i$ is the total number of issued common shares of company $i$.
- $\text{IWF}_i$ is the Investable Weight Factor (representing the percentage of shares trading freely in the public domain, excluding strategic stakes, insider control, and foundation holdings).
- The denominator represents the aggregate float-adjusted market capitalization of all 500 constituent corporations.
The Role of the Index Divisor
To ensure that non-market corporate events—such as secondary equity offerings, rights issuances, spin-offs, and constituent substitutions—do not alter the headline index level artificially, S&P Dow Jones Indices utilizes a mathematical scaling factor known as the Index Divisor:
$$\text{Index Level} = \frac{\sum (P_i \times Q_i \times \text{IWF}_i)}{\text{Divisor}}$$
When a corporate reorganization or other methodology-defined corporate action changes the aggregate market value of the index, the divisor is adjusted to preserve index continuity. This prevents specified non-market effects from creating artificial jumps or drops in the index level.
Sector Diversification and the Mega-Cap Concentration Dynamic
Quick Answer: What Sectors Comprise the S&P 500?
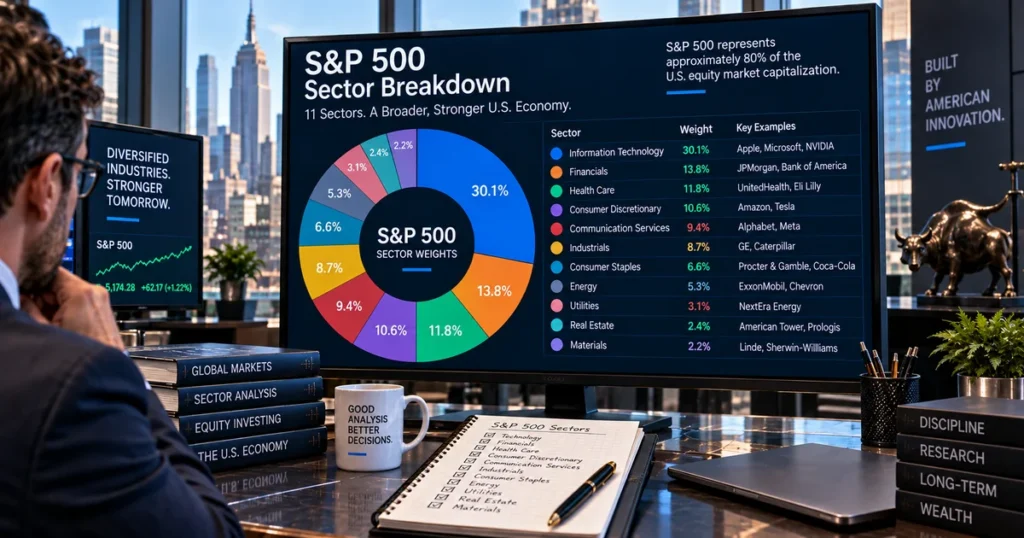
The S&P 500 classifies all constituents across the eleven Global Industry Classification Standard (GICS) sectors. While diversified across healthcare, financials, industrials, and consumer staples, the benchmark has experienced elevated concentration in enterprise technology and digital platform corporations.
Constituents are mapped across eleven definitive economic segments:
| GICS Sector | Primary Business Activities | Representative Blue-Chip Constituents |
| Information Technology | Cloud architecture, semiconductors, hardware, software | Microsoft, Apple, NVIDIA |
| Financials | Investment banking, insurance underwriting, credit | JPMorgan Chase, Berkshire Hathaway, Visa |
| Healthcare | Pharmaceuticals, medical devices, biotechnology | Eli Lilly, UnitedHealth Group, Johnson & Johnson |
| Consumer Discretionary | E-commerce, automotive, retail merchandising | Amazon, Tesla, Home Depot |
| Communication Services | Search networks, digital advertising, entertainment | Alphabet, Meta Platforms, Netflix |
| Industrials | Aerospace, logistics, defense, heavy manufacturing | Caterpillar, General Electric, Union Pacific |
| Consumer Staples | Food manufacturing, household goods, consumer retail | Procter & Gamble, Costco, Walmart |
| Energy | Integrated exploration, refining, midstream pipelines | ExxonMobil, Chevron, ConocoPhillips |
| Utilities | Regulated electric grids, gas distribution, clean power | NextEra Energy, Southern Company, Duke Energy |
| Real Estate | Real Estate Investment Trusts (REITs), commercial assets | Prologis, American Tower, Equinix |
| Materials | Industrial chemicals, packaging, mining, metals | Linde, Air Products, Freeport-McMoRan |
The Concentration Question: Mega-Cap Weighting Realities
Because the standard S&P 500 does not enforce a rigid individual constituent weighting cap (unlike European benchmarks like the Germany DAX 40 which caps constituents at 15%), sustained appreciation by mega-cap technology corporations has led to periods of elevated concentration. Recent periods have seen the top 10 constituents account for more than 30% of the index, although the exact concentration changes with market prices and index composition.
This heavy concentration means that aggregate benchmark performance can be significantly influenced by a handful of large balance sheets. To address this exposure, asset managers frequently compare standard float-weighted performance against the S&P 500 Equal Weight Index (SPXEW), which allocates an equal baseline weighting (approximately 0.20%) to all 500 companies at scheduled quarterly rebalancing intervals.
Performance Index vs. Price Index: The Total Return Mechanics
Quick Answer: How Do Dividends Affect the S&P 500?
The standard headline S&P 500 (
SPX) is a Price Return index that ignores dividend payouts. When a constituent stock trades ex-dividend, its share price drops by the payout amount, exerting a downward drag on the headline index. The S&P 500 Total Return Index (SPTR) accounts for this by mathematically reinvesting all gross cash dividends back into the portfolio.
Over multi-decade investment horizons, reinvested dividends can make a substantial contribution to cumulative equity returns. Because dividend yields and market valuations change over time, the difference between price-return and total-return performance varies across periods, with total-return compounding substantially expanding long-term wealth accumulation.
Operational Index Variations Compared:
| Dimension | S&P 500 Price Return (SPX) | S&P 500 Total Return (SPTR) | S&P 500 Equal Weight (SPXEW) |
| Calculation Basis | Price changes only | Price changes + Cash Dividends | Equal constituent weights |
| Headline Visibility | Standard benchmark quote | Primary institutional benchmark | Market breadth gauge |
| Dividend Accounting | Excluded from headline index | Reinvested continuously | Reinvested in total return version |
| Concentration Profile | Float-market-cap weighted | Float-market-cap weighted | Unweighted (Anti-concentration) |
Macroeconomic Drivers: The Fed, Treasury Yields, and Corporate Earnings

Quick Answer: What Forces Move the S&P 500?
S&P 500 price levels are influenced by several interrelated forces, including corporate earnings growth, Federal Reserve monetary policy, Treasury yields, valuation expectations, liquidity conditions, and broader economic and market sentiment, functioning similarly to the macro dynamics explored ininterest rates and exchange rates.
                      ┌─────────────────────────────────────────┐
                      │    MACRO TRANSMISSION CHANNELS TO SPX   │
                      └────────────────────┬────────────────────┘
                                           │
         ┌─────────────────────────────────┴─────────────────────────────────┐
         │                                                                   │
         ▼                                                                   ▼
┌──────────────────────────────────┐               ┌──────────────────────────────────┐
│ THE DISCOUNT RATE CHANNEL        │               │ CORPORATE EARNINGS CHANNEL       │
├──────────────────┤               ├──────────────────────────────────┤
│ * Treasury Yield Shifts:         │               │ * Operating Margin Growth:       │
│   Alter the discount rate applied│               │   Expands bottom-line cash flow  │
│   to projected corporate cash    │               │   and supports equity valuations,│
│   flows across long horizons     │               │   subject to broader conditions  │
│ * Rate Cycles:                   │               │ * Economic Contraction:          │
│   Influence corporate financing  │               │   Can dampen consumer and        │
│   costs and overall liquidity    │               │   enterprise spend, triggering   │
│   conditions across the market   │               │   downward earnings revisions    │
└──────────────────┘               └──────────────────────────────────┘
The Mechanism of Multiple Expansion and Contraction
Under standard institutional discounted cash-flow frameworks, an equity index’s valuation can be influenced by the present value of expected future cash flows and the discount rates applied to those cash flows. When the Federal Reserve tightens monetary policy by raising the federal funds rate, financial conditions can become more restrictive, although longer-term Treasury yields also depend on inflation expectations, economic growth, term premiums, and global demand:
- Short-term borrowing costs can rise across commercial lending channels, altering corporate capital expenditures, as examined in our study on Fed rate cuts and global liquidity.
- Longer-term Treasury yields may respond to changing expectations for inflation, growth, monetary policy, and term premiums.
- Higher discount rates can place valuation pressure on long-duration equities, particularly when expected future cash flows are highly sensitive to changes in discount rates.
- Conversely, monetary easing can improve financial conditions and support risk assets, but the market response depends on economic expectations, earnings prospects, liquidity conditions, and the path of interest rates.
Trading Mechanics: Regular Sessions, Extended Hours, and E-mini Futures

Quick Answer: When and How Is the S&P 500 Traded?
The primary continuous cash equity trading session runs on the New York Stock Exchange and Nasdaq from 09:30 to 16:00 Eastern Time (ET), Monday through Friday. Outside cash hours, global market participants trade CME E-mini (
ES) and Micro E-mini (MES) futures, which provide near 24-hour price discovery.
Detailed Session Architecture (Eastern Time):
- 04:00 – 09:30 ET (Pre-Market Cash Session): Extended-hours trading is available through participating exchanges and electronic venues, generally with lower liquidity and potentially wider bid-ask spreads than the regular session.
- 09:30 ET (The Cash Market Open): Primary opening cross auctions on the NYSE and Nasdaq establish opening cash prices, unleashing the highest volume surge of the trading day.
- 16:00 ET (The Closing Auction): Closing crosses execute institutional block orders and passive ETF rebalancing flows, finalizing official cash closing prints.
- 16:00 – 20:00 ET (Post-Market Cash Session): After-hours earnings releases and corporate announcements are priced by market participants across electronic venues.
- Continuous Derivatives Window (CME Globex): S&P 500 E-mini futures trade from 18:00 ET Sunday through 17:00 ET Friday (with a daily maintenance halt from 17:00 to 18:00 ET), providing continuous liquidity during European and Asian trading sessions.
S&P 500 Market-Wide Circuit Breakers (MWCB)
Following structural market stress episodes, the US Securities and Exchange Commission (SEC) and primary exchanges enforce strict Market-Wide Circuit Breakers calculated daily based on the prior close of the S&P 500:
- Level 1 (-7% decline): Triggers a mandatory 15-minute halt across covered US securities markets if breached prior to 15:25 ET.
- Level 2 (-13% decline): Triggers a second mandatory 15-minute market halt if breached prior to 15:25 ET.
- Level 3 (-20% decline): Triggers a market-wide halt in covered U.S. securities markets for the remainder of the regular trading day. Related equity-index derivatives may also be subject to corresponding regulatory trading halts under their applicable exchange rules.
How to Invest and Trade the S&P 500
Quick Answer: What Vehicles Are Used to Access the S&P 500?
Investors and institutional allocators gain exposure to the S&P 500 through Exchange-Traded Funds (ETFs), index mutual funds, index futures, and standardized index options contracts, matched to their specific investment horizon, leverage requirements, and regulatory jurisdiction.
+---------------------------------------------------------------------------------------------------+
|                        S&P 500 INVESTMENT & SPECULATION INSTRUMENTS                               |
+---------------------+-----------------------------+-----------------------+-----------------------+
| VEHICLE CATEGORY    | PROMINENT INSTRUMENTS       | PRIMARY SUITABILITY   | OPERATIONAL ATTRIBUTES|
+---------------------+-----------------------------+-----------------------+-----------------------+
| **S&P 500 ETFs**    | `SPY` (State Street SPDR)   | Passive long-term     | Highly liquid; expense|
|                     | `IVV` (iShares Core S&P)    | allocators, retail    | ratios and replication|
|                     | `VOO` (Vanguard S&P 500)    | wealth portfolios     | depend on fund specs  |
| **Index Futures**   | `ES` (CME E-mini Futures)   | Institutional funds,  | Standardized leverage;|
|                     | `MES` (Micro E-mini)        | active macro traders  | quarterly expiration; |
|                     |                             |                       | cleared via CME       |
| **Cash Options**    | `SPX` (Cboe Index Options)  | Systematic hedgers,   | European-style; cash- |
|                     | `XSP` (Mini-SPX Options)    | institutional options | settled; specific tax |
|                     |                             | traders               | rules may apply in US |
+---------------------+-----------------------------+-----------------------+-----------------------+
Comparative Analysis: USA S&P 500 vs. Global Equity Benchmarks
Quick Answer: How Does the S&P 500 Compare to the Nasdaq-100, Dow Jones, and DAX 40?
The S&P 500 represents the most balanced broad-market reflection of US large-cap corporations. Compared to the tech-heavy Nasdaq-100, the S&P 500 includes financial and industrial institutions; compared to the Dow Jones Industrial Average, it weights by market capitalization rather than arbitrary share prices; and compared to the Germany DAX 40, it tracks pure price returns rather than automatically compounding dividends.
| Dimension / Metric | USA S&P 500 (SPX) | Nasdaq-100 (NDX) | Dow Jones Industrial (DJI) | Germany DAX 40 (DAX) |
| Constituent Count | 500 Companies | 100 Non-Financials | 30 Large US Companies | 40 Blue Chips |
| Weighting Method | Float-Adjusted MCap | Modified MCap | Share-Price-Weighted | Float-Adjusted MCap |
| Quoted Return Type | Price Return | Price Return | Price Return | Total Return (Perf.) |
| Financial Inclusion | Yes (Full Sector) | No (Excluded) | Yes (Selected) | Yes (Allianz, etc.) |
| Concentration Cap | None (Pure Float) | Dynamic rebalance caps | Price-scaled distortion | 15% Single Cap |
| Governance Engine | U.S. Index Committee | Quantitative Formula | Selection Committee | Strict Rulebook (EBITDA) |
Common Myths vs. Empirical Facts
- Myth: The S&P 500 automatically contains the 500 largest US companies by valuation.
- Fact: Inclusion requires meeting strict committee criteria, including cumulative positive GAAP profitability across four quarters, sufficient liquidity, and US corporate domicile. Fast-growing, unprofitable corporations are routinely excluded regardless of raw market valuation.
- Myth: S&P 500 companies are completely insulated from international foreign exchange volatility.
- Fact: A substantial portion of aggregate S&P 500 corporate revenues is generated outside the United States. A surging US Dollar can act as an international headwind by making American exports more expensive and reducing the dollar value of foreign corporate earnings.
- Myth: The S&P 500 is an equally weighted index of 500 stocks.
- Fact: The benchmark is market-cap weighted. The largest ten mega-cap corporations often represent over 30% of total index value, meaning broad index swings can obscure stagnation among lower-tier constituent equities.
- Myth: When an index constituent is removed, its shares become worthless.
- Fact: Deletion from the index simply indicates that a company no longer fulfills index criteria or was acquired in an M&A transaction. The equity continues trading on its native exchange, though passive fund rebalancing may exert temporary selling pressure.
Frequently Asked Questions
What does “S&P” stand for?
S&P stands for Standard & Poor’s, reflecting the 1941 corporate merger between Poor’s Publishing Company (founded by Henry Varnum Poor in 1860) and the Standard Statistics Bureau (established in 1906).
How often does the S&P 500 rebalance?
S&P Dow Jones Indices executes scheduled quarterly rebalancings in March, June, September, and December, with constituent additions and deletions occurring as corporate transactions and eligibility changes dictate.
Why does the S&P 500 have more than 500 constituent securities?
While the S&P 500 represents 500 companies, the index can contain more than 500 constituent securities (often 503) because certain companies have multiple eligible share classes represented in the index (for example, Alphabet Class A GOOGL and Class C GOOG).
What is the difference between SPX and SPY?
SPX is the official underlying financial index calculated by S&P Dow Jones Indices. SPY (the SPDR S&P 500 ETF Trust) is an exchange-traded fund designed to track the S&P 500 that invests primarily in the securities represented by the index.
Does the S&P 500 include foreign companies?
No. The official index methodology restricts eligibility to US-domiciled operating companies. International corporations trading via American Depositary Receipts (ADRs) are ineligible, regardless of size or trading volume.
What happens to dividends paid by S&P 500 companies?
In the standard headline price index (SPX), dividends are not included in the quote; constituent share prices drop on the ex-dividend date. In the S&P 500 Total Return Index (SPTR), dividends are mathematically factored back into the portfolio return.
Can a single company dominate the entire S&P 500?
The standard S&P 500 does not impose a fixed single-constituent weight cap comparable to the DAX 40’s 15% limit. As a result, very large companies can become a substantial share of the index as their float-adjusted market capitalizations increase. Separate regulatory diversification requirements may apply to investment funds that seek to track or invest in the index, but those rules are distinct from the S&P 500’s own index methodology.
Strategic Summary & Core Takeaways
- The Ultimate Capital Proxy: The USA S&P 500 serves as the primary benchmark for global equity markets, encompassing roughly 80% of available US public equity capitalization.
- Methodology Over Simple Size: Inclusion is governed by an expert Index Committee requiring proven GAAP profitability, strong trading liquidity, and public float availability rather than raw valuation alone.
- Float-Adjusted Foundation: Weightings accurately reflect shares trading freely in public hands, preventing strategic or insider share blocks from distorting index performance.
- Macroeconomic Sensitivity: The S&P 500 is sensitive to changes in Federal Reserve policy, Treasury yields, corporate earnings, valuation expectations, liquidity conditions, and broader financial conditions.
- Continuous Derivatives Liquidity: CME S&P 500 futures provide near-round-the-clock price discovery and hedging access outside regular U.S. cash-equity hours, making them an important channel for monitoring global risk sentiment.
Next Reading Suggestions
- Germany DAX 40: The Complete Guide to Components, Total Return Methodology, and Global Market Mechanics
- How Stock Prices Are Determined: Market Microstructure, Supply and Demand, and Valuation
- What Is Market Capitalization? The Complete Guide to Market Cap, Company Size, and Valuation
- Interest Rates and Exchange Rates: The Complete Guide to Global Currency Pricing
- Fed Rate Cuts & Global Liquidity: The Complete Guide to Interest Rates, the Fed Balance Sheet, and Asset Markets
- What Is Gold? The Complete Guide to Real Money, Store of Value & Why It Matters
- Crypto Market Cycles: The Complete Guide to Bitcoin Halvings, Global Liquidity, On-Chain Metrics, and Alt Seasons
Author Box & E-E-A-T Verification
Written & Researched By: CurrencyPlans Editorial Research Team
Editorial Review & Methodological Standards: This guide is based on publicly available index methodology, exchange documentation, and regulatory materials. Key topics—including float-adjusted market capitalization, S&P 500 inclusion criteria, index-divisor mechanics, trading sessions, and S&P 500 derivatives—are explained using primary-source documentation from S&P Dow Jones Indices, CME Group, Cboe Global Markets, and the U.S. Securities and Exchange Commission (SEC).
Educational References & Market Data Sources
For official index rulebooks, divisor mechanics, and exchange specifications, consult primary regulatory and market data repositories directly:
- S&P Dow Jones Indices (Equity Index Methodology & Policies): S&P Dow Jones Indices
- CME Group (S&P 500 E-mini and Micro E-mini Futures Specifications): CME Group
- Cboe Global Markets (SPX Cash-Settled Index Options Directory): Cboe Exchange
- U.S. Securities and Exchange Commission (Market Structure & Circuit Breakers): SEC Regulatory Repository
- Federal Reserve Economic Data (FRED – St. Louis Fed Macro Statistics): FRED Data
Educational Disclaimer
This guide is prepared strictly for educational, research, and informational purposes and does not constitute personalized financial, investment, trading, or tax advice. Large-cap equity indices, derivatives, leveraged instruments, and related financial products carry financial risks. Historical returns of the S&P 500 do not guarantee future investment performance. Always conduct independent due diligence and consult a licensed fiduciary financial advisor before committing trading capital.

