

The landscape of modern equity trading did not evolve by accident. It was forged through intense structural shifts, regulatory mandates, and technological mutations that continuously rewrote the rules of engagement for market participants. To truly grasp how institutional order flow, sweeping algorithms, and dark pools operate in the contemporary environment, one must examine the deep, iterative layers of Nasdaq history.
What began in 1971 as a fragmented, decentralized network of telephone-reliant market makers typing quotes into monochrome screens has mutated into an ultra-low-latency matching engine executing trades in mere microseconds. This transition was not a smooth progression, but rather a chaotic evolution propelled by market crises, structural exploits like the SOES arbitrage era, and pivotal regulatory overhauls.
For institutional desks, algorithmic traders, and market makers, understanding this historical trajectory is more than an academic exercise—it is a masterclass in market microstructure. Every modern protocol, from price-time priority matching to opening and closing cross auctions at the Carteret data center, directly descends from these historical inflection points. Tracing this lineage reveals how the democratization of electronic data systematically dismantled floor-based monopolies, permanently shifting global liquidity dynamics.
Featured Snippet Block
Nasdaq history represents the structural transition of global equity markets from physical, floor-based open outcry systems to fully automated, electronic matching engines. Founded in 1971 by the National Association of Securities Dealers (NASD), it introduced the world’s first computerized quotation system, fundamentally transforming market making, order routing, and institutional liquidity dynamics.
Key Takeaways: How Nasdaq Reshaped Global Market Infrastructure
- Pioneered Electronic Execution: Displaced physical trading pits with decentralized digital order books.
- Democratized Market Access: Forced structural transparency through automated quote dissemination.
- Catalyzed Regulatory Evolution: Prompted the creation of modern SEC order handling rules following structural exploits.
- Transformed Liquidity Provision: Transitioned the market from manual phone-based market making to algorithmic passive liquidity.
The Chronological Timeline of Nasdaq History
1971–1987: The Birth of the World’s First Electronic Stock Market
On February 8, 1971, the National Association of Securities Dealers Automated Quotations (Nasdaq) system officially launched. It did not start as an execution venue. Instead, it functioned as a digital bulletin board, broadcasting bid and ask quotes for over-the-counter (OTC) securities that previously relied on printed “pink sheets.”
That behavior became particularly visible during its first decade. Market makers physically typed their quotes into terminals, but actual trade executions still required manual telephone confirmation. This hybrid structure introduced significant friction into institutional order flow.
The structural landscape shifted dramatically in 1984 with the introduction of the Small Order Execution System (SOES). This module was designed to automate the execution of small retail orders, bypassing the necessity of phone confirmations.

1987–1997: The SOES Bandits and Regulatory Overhauls
The true stress test of this early electronic architecture arrived during the October 1987 market crash. As panic selling flooded the market, many manual market makers simply stopped answering their phones.
In response, the Securities and Exchange Commission (SEC) made participation in SOES mandatory. This regulatory pivot inadvertently birthed a new class of market participants known as the “SOES Bandits.”
These early day traders exploited a specific structural flaw: market makers were slow to manually update their quotes on the Nasdaq terminals when the broader market moved. SOES Bandits used software to hit these stale quotes instantly, locking in risk-free arbitrage profits at the expense of major market-making desks.
This era culminated in the historic 1997 SEC Order Handling Rules, which forced the integration of Electronic Communication Networks (ECNs) directly into the Nasdaq quote montage.
1997–2005: Decimalization, Dot-Com Volatility, and the Rise of ECNs
The late 1990s tested the absolute capacity of electronic quote networks. The dot-com boom brought unprecedented retail and institutional volume to tech stocks like Microsoft, Intel, and Cisco.
When the bubble burst in 2000, market makers faced massive liquidity sweeps and intense structural volatility.
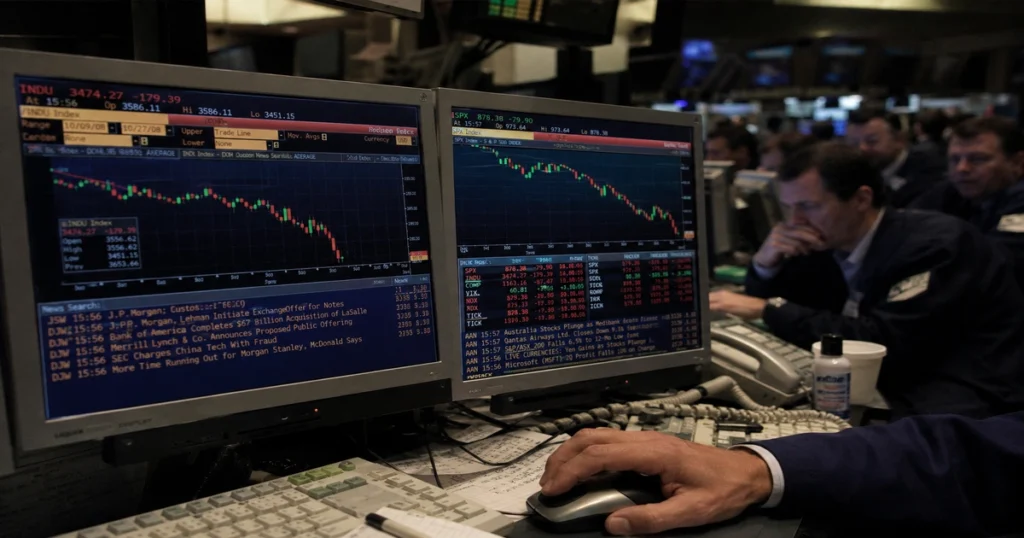
In 2001, global exchanges abandoned fractional pricing (e.g., trading in sixteenths of a dollar) in favor of decimalization. Spreads compressed from $0.0625 to pennies overnight.
The traditional profit margins of phone-based market makers evaporated. To survive, the exchange transformed its architecture by acquiring cutting-edge ECNs like Brut and Island, paving the way for the launch of the unified Nasdaq Market Center.
2005–Present: The High-Frequency Trading Era and Global Consolidation
By obtaining a formal exchange license in 2006, Nasdaq fully separated from its legacy NASD roots. It merged with the Scandinavian exchange group OMX in 2008, cementing its identity as an international technology powerhouse.
Execution speeds shifted from milliseconds to microseconds.
Today, matching engines are housed in heavy server architecture like the Carteret, New Jersey data center. The market is now completely dominated by high-frequency trading (HFT) operations using co-located servers to capture micro-structural inefficiencies.
Institutional Analysis: Understanding Order Flow Evolution
The Shift from Phone-Based Market Making to Passive Liquidity Provision
A closer inspection of the order book reveals that the role of the market maker has completely transformed. In the early chapters of Nasdaq history, humans controlled the spread. They managed inventory by widening their bids and offers during times of stress.
In the modern microstructure, liquidity is largely algorithmic. Passive liquidity provision relies on automated market makers deploying complex mathematical frameworks to post resting limit orders on the book.

Structural Arbitrage and Cumulative Volume Delta in Modern Trading
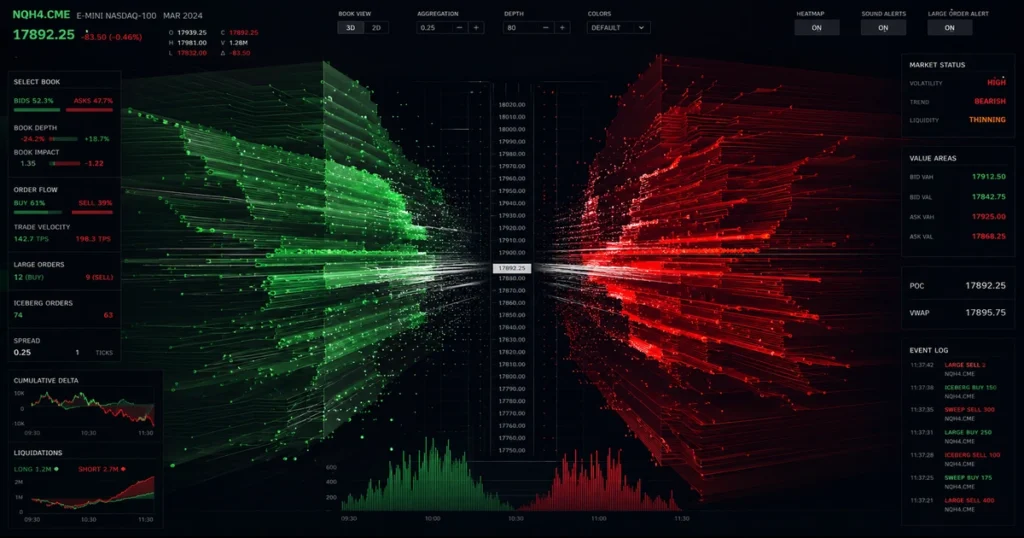
Because matching engines process order flow at near-instantaneous speeds, institutions can no longer rely on simple visual chart analysis. Instead, they utilize tools like Cumulative Volume Delta (CVD) to measure the net difference between aggressive buying and selling pressure in real time.
When an institution executes a massive liquidity sweep, they systematically consume the available passive limit orders resting across multiple price levels.
| Era | Primary Execution Method | Average Spread (Large Cap) | Latency Metric |
| 197x Origins | Telephone / Manual Input | $0.25 – $0.50 | Minutes |
| 199x SOES Era | Automated Retail / ECNs | $0.125 (1/8th) | Seconds |
| 200x Decimalization | Integrated Matching Engine | $0.01 – $0.02 | Milliseconds |
| Modern HFT Era | Co-located Algorithmic Systems | Ultra-tight ($0.01) | Microseconds |
Market Microstructure: How Nasdaq Matches Orders Today
The modern exchange functions on a strict price-time priority rule allocation structure. The first order placed at the best available price is always the first order executed.
The Mechanics of the Nasdaq Cross (Opening and Closing Auctions)
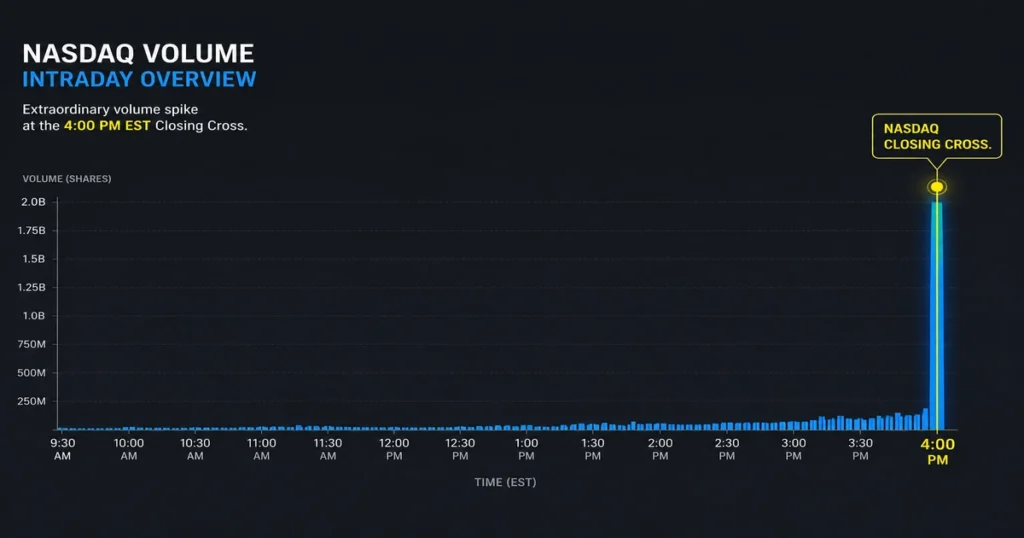
While continuous trading occurs from 9:30 AM to 4:00 PM EST, the most critical institutional volume is handled through specialized execution points: the Opening Cross and Closing Cross.
These auctions are designed to concentrate liquidity into a single moment, preventing massive price dislocations.
- Imbalance Dissemination: Starting at 3:55 PM EST, the exchange broadcasts Net Order Imbalance Indicator (NOII) messages every second.
- Order Matching: The algorithm parses standard limit orders, market orders, and specialized Imbalance Only (IO) orders.
- Cross Execution: At exactly 4:00 PM EST, the matching engine calculates the single price that maximizes the number of shares paired, printing the official closing price for the broader market.
Mapping the Modern Nasdaq Architecture
The following diagram illustrates how an institutional order routes through the modern electronic architecture to achieve execution inside the matching engine.
[Institutional / Retail Order]
               │
               ▼
   [Smart Order Router (SOR)]
               │
      ┌────────┴────────┐
      ▼                 ▼
[Direct Feed / FIX]  [Co-located HFT Systems]
      │                 │
      └────────┬────────┘
               ▼
   [Nasdaq Carteret Gateway]
               │
               ▼
  [Price-Time Priority Engine]
               │
      ┌────────┴────────┐
      ▼                 ▼
[Continuous Book]    [Opening/Closing Cross]
      │                 │
      └────────┬────────┘
               ▼
    [Trade Execution / SIP]
Structural Comparison: Nasdaq vs. Legacy Floor-Based Exchanges
For decades, the competitive dynamics between Nasdaq and the New York Stock Exchange (NYSE) defined the American financial landscape.
While the NYSE relied on designated specialists managing physical order books on a central floor, Nasdaq pioneered a competing dealer model. In this decentralized structure, multiple market makers competed directly with one another for execution volume.
Over time, these structural differences largely converged, forcing legacy floor-based venues to adopt the electronic routing protocols popularized throughout Nasdaq history.
Frequently Asked Questions About Nasdaq History
What was the original purpose of Nasdaq when it launched in 1971?
Nasdaq was initially built to provide a centralized, electronic system for broadcasting bid and ask quotations for over-the-counter (OTC) securities. It did not trade stocks directly at launch; rather, it automated the quote visibility that previously required scanning printed sheets or making multiple phone calls.
How did the SOES Bandits exploit early Nasdaq market structure?
The “SOES Bandits” took advantage of a latency gap in the Small Order Execution System during the late 1980s and 1990s. When the broader market shifted quickly, manual market makers failed to immediately update their posted quotes. Bandits used automated systems to execute against these stale prices, locking in quick profits.
What structural changes did decimalization cause in 2001?
Decimalization replaced fractional stock pricing with standard penny increments. This change dramatically compressed bid-ask spreads, making transactions cheaper for retail investors. However, it also stripped away the high risk-free profit margins traditionally enjoyed by old-school market making firms.
Where are the modern Nasdaq matching engines physically located?
Though headquartered in New York City, the actual primary matching engines and server infrastructure for Nasdaq are located inside a massive, secure data center facility in Carteret, New Jersey. High-frequency firms pay premium fees to place their own servers inside this same building.
Why is the Nasdaq Closing Cross important for institutional order flow?
The Closing Cross concentrates immense liquidity at the very end of the trading day. By running a specialized auction that pairs large buy and sell imbalances into a single price print, it gives institutions a highly efficient way to execute major block trades without causing massive, unintended spikes in the stock price.
Terminal Wrap-Up & Discussion
The journey of Nasdaq from a fragmented quote bulletin board to an automated, microsecond-level matching powerhouse illustrates the unstoppable march of market technology. Each phase of its structural evolution was driven by an ongoing arms race between liquidity providers, sophisticated arbitrageurs, and changing regulatory frameworks. Today, navigating this landscape requires a deep mechanical knowledge of how order flow is handled behind the screen.
How is your trading desk adapting to modern order routing and auction imbalances? Let us know your thoughts on the evolution of matching mechanics in the comments below.
Educational Financial Disclaimer
This article is for educational, informational, and historical purposes only. It does not constitute financial, investment, or legal advice. Market microstructure conditions change rapidly, and past structural patterns do not guarantee future market behavior. Trading financial instruments involves significant risk of capital loss.

