
Introduction
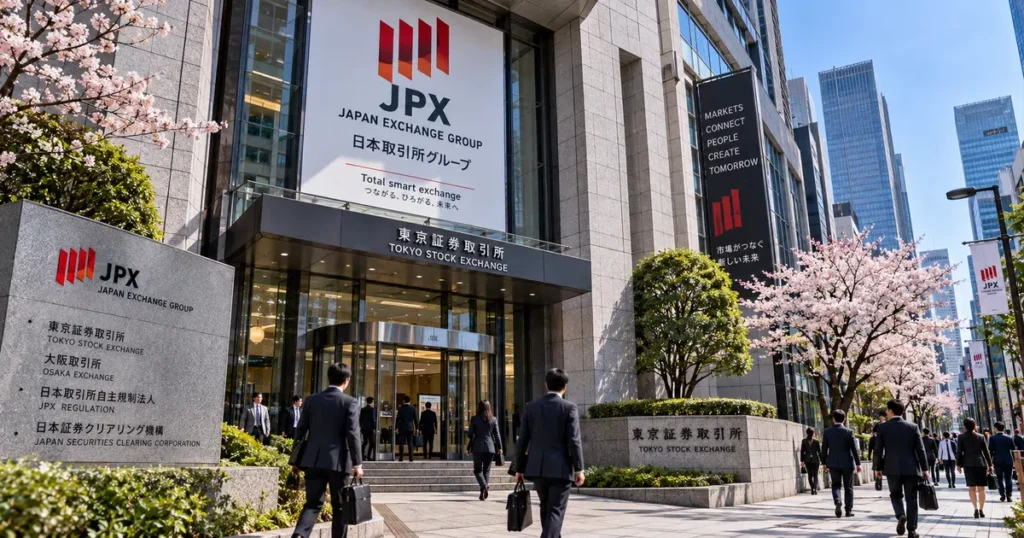
The Japan Nikkei 225 (officially the Nikkei Stock Average) is the preeminent Japanese equity benchmark, calculated by Nikkei Inc. since 1950 and comprising 225 highly liquid companies listed on the Prime Market of the Tokyo Stock Exchange (TSE). As one of Asia’s longest-running major stock benchmarks, the Nikkei 225 serves as an important reference for passive exchange-traded funds (ETFs), derivative products, and institutional market participants globally.
Understanding the Nikkei 225 requires analyzing its distinct modified price-weighted methodology, its heavy exposure to precision electronics and industrial manufacturing, its sensitivity to the Japanese Yen (JPY), and the monetary policy framework of the Bank of Japan (BOJ), aligning with the foundational mechanics detailed in how stock prices are determined.
Executive Summary: Price Return and Total Return Benchmarks
Quick Answer: What Is the Japan Nikkei 225?
The Japan Nikkei 225 is a modified price-weighted benchmark tracking 225 large, highly liquid blue-chip companies listed on the Prime Market of the Tokyo Stock Exchange. Maintained by Nikkei Inc., the index is calculated in real time at five-second intervals during market hours. While the headline index is a Price Return gauge, the Nikkei 225 Total Return Index incorporates cash dividends, making it useful for evaluating total investment performance.
                          ┌──────────────────────────────────────────┐
                          │         JAPANESE EQUITY MARKET           │
                          └───────────────────┬──────────────────────┘
                                              │
        ┌─────────────────────────────────────┴─────────────────────────────────────┐
        │                                                                           │
        ▼                                                                           ▼
┌───────────────────────────────────────┐                    ┌──────────────────────────────────────┐
│ NIKKEI STOCK AVERAGE                  │                    │ TOPIX INDEX                          │
├───────────────────────────────────────┤                    ├──────────────────────────────────────┤
│ * Price-Weighted Methodology          │                    │ * Free-Float Market Cap-Weighted     │
│ * Exclusively 225 Blue-Chip Equities  │                    │ * Broad Japanese Equity Benchmark    │
│ * Ticker-Centric, Headline Sensitive  │                    │ * Prime, Standard & Growth Universe  │
│ * Similar Price-Weight Role to DJIA   │                    │ * Similar Broad-Market Role to S&P500│
└───────────────────────────────────────┘                    └──────────────────────────────────────┘
The Institutional Dual-Benchmark System
Japan’s equity architecture is evaluated using two distinct benchmarks:
- Nikkei 225: The widely recognized price-weighted barometer, sensitive to individual share prices and international corporate earnings revisions.
- TOPIX (Tokyo Stock Price Index): Japan’s broad-market institutional benchmark. It is a free-float-adjusted market-capitalization-weighted index, with its methodology being revised to include eligible securities across the Prime, Standard, and Growth Markets while placing greater emphasis on liquidity.
The Structural Evolution: From Post-War Reconstruction to Modern Benchmark
Quick Answer: What Is the History of the Nikkei 225?
The benchmark traces its calculation back to May 16, 1949, with the Tokyo Stock Exchange beginning calculation and publication of the TSE stock-price average in September 1950. Maintenance was transferred to Nikkei Inc. (Nihon Keizai Shimbun) in 1970. Defined historically by its December 1989 bubble peak of 38,915.87 yen, the modern index reflects corporate governance modernizations and structural exposure to global industrial supply chains.
The timeline of Japanese equity market development includes key operational milestones:
- 1878: Establishment of the Tokyo Stock Exchange Co., Ltd., inaugurating formal equity trading in Japan.
- 1943: Amalgamation of regional exchanges into the unified Japan Securities Exchange during WWII.
- May 16, 1949: Formal reopening of the Tokyo Stock Exchange under post-war securities regulations, establishing the baseline level for the average at 176.21 yen.
- September 1950: The TSE began calculating and publishing the official stock-price average.
- 1970: Transfer of index calculation and administration from the TSE to Nikkei Inc.
- December 29, 1989: The Nikkei 225 reaches its historic closing peak of 38,915.87 yen at the height of Japan’s asset price bubble.
- 2022: The TSE restructures its market segments, introducing the Prime, Standard, and Growth Markets. The Nikkei 225 continues to select constituents exclusively from the Prime Market.
Eligibility & Inclusion Criteria: High Liquidity Groups and Semi-Annual Reviews
Quick Answer: How Are Companies Selected for the Nikkei 225?
To enter the Nikkei 225, a company must be a domestic common stock listed on the TSE Prime Market and qualify through Nikkei’s quantitative liquidity evaluation and sector-balance rules. Reviews occur semi-annually in April and October, screening stocks over a trailing five-year period across six industry sectors.
Selection is managed through defined quantitative rules established by Nikkei Inc.:
1. The Selection Universe
The selection universe consists of eligible domestic common stocks listed on the Prime Market of the Tokyo Stock Exchange.
2. The Quantitative Liquidity Screening
Nikkei assesses liquidity using two core metrics evaluated over the preceding five years:
- Trading value over the preceding five years.
- Magnitude of price fluctuation by trading value over the preceding five years (calculated using high/low price ratios relative to traded value).
3. The High Liquidity Group (Top 450)
The top 450 most liquid Prime Market stocks form the High Liquidity Group:
- Candidate Additions: Non-constituent stocks ranked within the top 75 of the High Liquidity Group qualify for priority addition, subject to sector balance rules.
- Constituent Removals: Existing constituents that fall outside the top 450 of the High Liquidity Group face deletion to ensure the index retains high liquidity.
4. Sector Balance Across Six Classifications
The High Liquidity Group is classified into six sector categories:
- Technology (e.g., Electronics, Precision Instruments, Communications).
- Financials (e.g., Banks, Securities, Insurance).
- Consumer Goods (e.g., Retail, Automobiles, Food).
- Materials (e.g., Chemicals, Steel, Trading Companies).
- Capital Goods / Others (e.g., Machinery, Construction, Real Estate).
- Transportation / Utilities (e.g., Railroads, Marine Transport, Power Utilities).
Nikkei evaluates constituent representation across these sectors and can make additions or deletions to maintain sector balance while preserving the index’s representative and liquid character. The process is based on the composition of the High Liquidity Group rather than matching each sector’s share of the broader TSE Prime Market.
5. Semi-Annual Periodic Reviews
Nikkei Inc. conducts periodic reviews twice a year, with results becoming effective on the first trading day of April and October. The maximum number of periodic-review constituent changes is generally limited to three stocks per review to minimize portfolio turnover for tracking funds.
Index Methodology: Modified Price-Weighting, Divisor, and PAF Mechanics
Quick Answer: How Is the Japan Nikkei 225 Calculated?
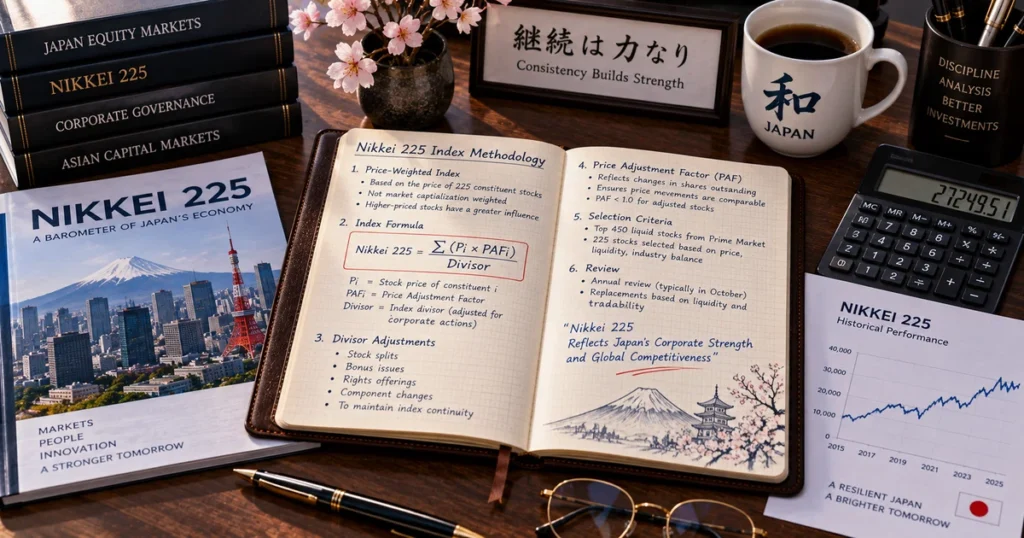
The Japan Nikkei 225 is calculated using a modified price-weighted methodology. The sum of the adjusted prices of all 225 constituents is divided by the Nikkei Divisor, an official scaling factor that preserves index continuity when prices change due to non-market corporate events.
$$\text{Index Level} = \frac{\sum_{i=1}^{225} \text{Adjusted Stock Price}_i}{\text{Nikkei Divisor}}$$
Where:
$$\text{Adjusted Stock Price}_i = \text{Market Price}_i \times \text{Price Adjustment Factor (PAF)}_i$$
The Function of the Nikkei Divisor
Because the benchmark is price-weighted rather than market-cap-weighted, stock splits, reverse splits, or constituent replacements would cause arbitrary gaps in the index if left unadjusted. The Nikkei Divisor is systematically updated during corporate events so that the index level opens at the exact mathematically equivalent level following a corporate change, reflecting principles similar to those covered in what is market capitalization.
The headline Nikkei 225 is a price-return index; its methodology incorporates corporate-action and dividend-related adjustments so that mechanically caused price changes do not distort index continuity.
Price Adjustment Factors (PAF) and Weight Capping
To prevent single high-priced constituents from commanding an outsized influence over the index:
- Standard PAFs: Nikkei assigns Price Adjustment Factors based on historical par value conversions and stock split ratios.
- Weight Capping: Nikkei applies constituent weight-capping mechanisms to limit excessive influence from individual high-weight constituents. The applicable capping rules and ratios are defined in the current Nikkei Stock Average methodology.
Macroeconomic Drivers: BOJ Monetary Policy, Yen Valuation, and Asian Trade
Quick Answer: What Macro Factors Move the Japan Nikkei 225?
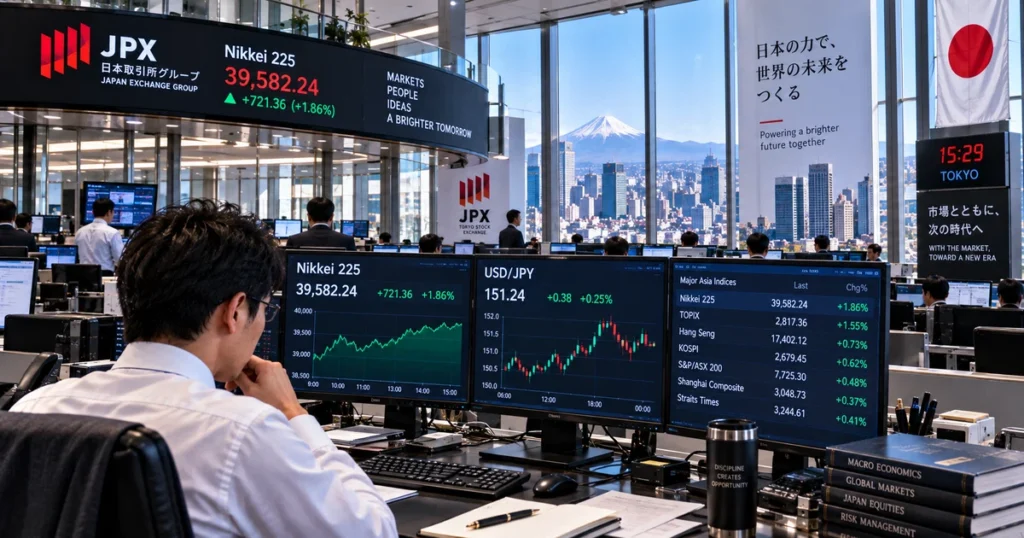
Among the major macroeconomic factors influencing the Nikkei 225 are Bank of Japan (BOJ) monetary policy and interest rate decisions, movements in the Japanese Yen (USD/JPY), and global industrial production across key trade partners.
                       ┌──────────────────────────────────────────────┐
                       │    MACRO TRANSMISSION CHANNELS TO NIKKEI     │
                       └──────────────────────┬───────────────────────┘
                                              │
         ┌────────────────────────────────────┴─────────────────────────────────────┐
         │                                                                          │
         ▼                                                                          ▼
┌───────────────────────────────────────┐                    ┌───────────────────────────────────────┐
│ BOJ MONETARY POLICY TRANSMISSION      │                    │ CURRENCY DYNAMICS & GLOBAL EXPORTS    │
├───────────────────────────────────────┤                    ├───────────────────────────────────────┤
│ * Policy Interest Rates:              │                    │ * USD/JPY Exchange Rate:              │
│   Shifts in the short-term policy     │                    │   Directly impacts offshore corporate │
│   rate influence commercial yields    │                    │   revenue translation into Yen        │
│ * Domestic Bank Profitability:        │                    │ * Exporter Sensitivity:               │
│   Yield shifts impact net interest    │                    │   Yen depreciation can support profit │
│   margins across megabanks            │                    │   translation for global exporters    │
└───────────────────────────────────────┘                    └──────────────────────────────────────┘
1. Bank of Japan (BOJ) Policy Transmission
Changes in the Bank of Japan’s policy rate, financial conditions, bond-market yields, and broader monetary policy expectations can influence Japanese equity valuations, bank profitability, currency movements, and investor positioning. Policy shifts influence the cost of borrowing for domestic firms, shifting capital allocations between fixed income and equity sectors, mechanisms analyzed in interest rates and exchange rates.
2. The Japanese Yen Dynamic (USD/JPY)
Because a substantial portion of Nikkei 225 constituents generate a large share of revenue abroad:
- A weaker yen can support the earnings translation of large Japanese exporters, although the Nikkei–yen relationship varies by sector, valuation, import costs, and the broader macro environment.
- Conversely, a strengthening yen can reduce the domestic-currency value of overseas earnings, creating headwinds for automotive and electronic component exporters while reducing import costs for domestic utilities.
Sector Composition: Precision Manufacturing and Technology Leaders
Quick Answer: What Sectors Dominate the Nikkei 225?
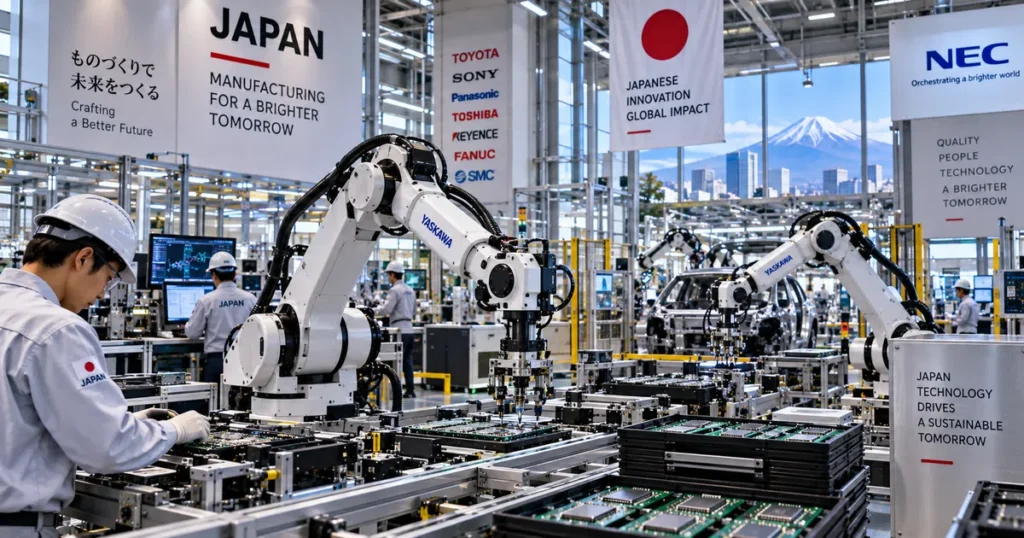
The Nikkei 225 is heavily weighted toward Technology and Consumer Goods. Due to price-weighting mechanics, high-priced semiconductor, precision instrument, and retail conglomerates represent a substantial proportion of aggregate index movements.
Constituents are categorized under Nikkei’s six official sector classifications:
Nikkei 225 Sector Breakdown
| Nikkei Sector | Weight — Sep. 11, 2026* | Primary Exposure | Representative Blue-Chip Constituents |
| Technology | 56.24% | Electronics, semiconductors, precision instruments, communications | Tokyo Electron, Advantest, SoftBank Group, Keyence, Sony Group |
| Consumer Goods | 19.76% | Retail, services, automobiles, consumer businesses | Fast Retailing (Uniqlo), Toyota Motor, Nintendo, Seven & i Holdings |
| Materials | 12.54% | Chemicals, metals, trading companies, related industries | Shin-Etsu Chemical, Mitsubishi Corporation, Mitsui & Co., Toray |
| Capital Goods / Others | 6.99% | Machinery, construction, transportation equipment, real estate | Daikin Industries, Komatsu, Mitsubishi Heavy Industries, Hitachi |
| Financials | 3.11% | Banks, securities, insurance | Mitsubishi UFJ Financial (MUFG), Sumitomo Mitsui (SMFG), Nomura |
| Transportation / Utilities | 1.36% | Rail, marine transport, utilities, infrastructure | East Japan Railway (JR East), Nippon Yusen (NYK Line) |
*Source note: Nikkei Inc. Component & Sector Data, official sector distribution as of September 11, 2026. Sector weights change with constituent prices and index adjustments.
Corporate Influences on the Index
- Semiconductor and Precision Capital: Heavyweights such as Tokyo Electron and Advantest play a major role in driving the Technology sector’s weighting, with earnings tied to global semiconductor capital expenditure cycles and artificial intelligence infrastructure demand.
- Automotive and Retail Anchors: Toyota Motor is one of Japan’s largest and most globally significant automobile manufacturers, while retail powerhouse Fast Retailing holds a prominent position due to price-weighting mechanics.
Trading Mechanics: Daily Sessions, Midday Break, and the 15:30 Close
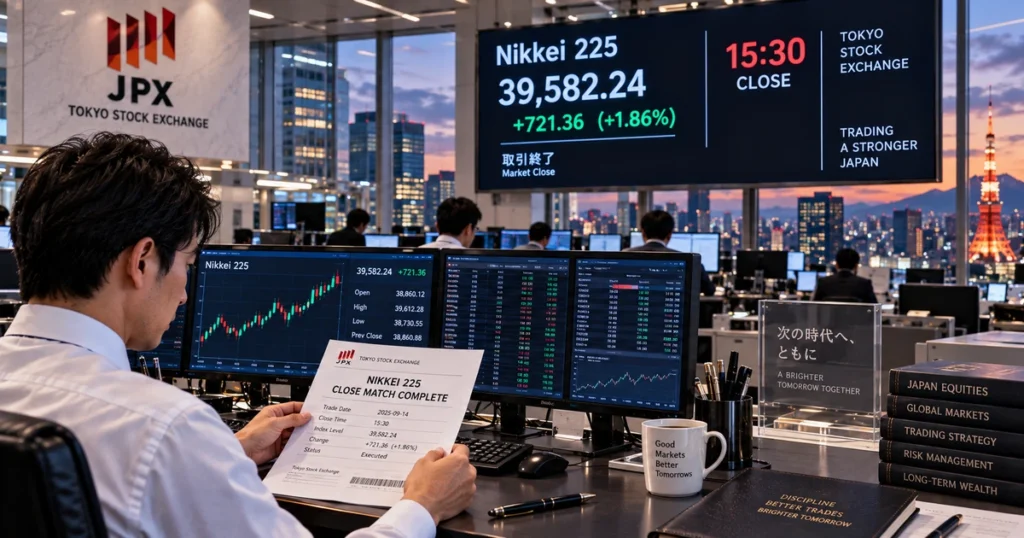
Quick Answer: When Does the Tokyo Stock Exchange Trade?
The Tokyo Stock Exchange operates Monday through Friday across a morning session (09:00–11:30 JST) and an afternoon session (12:30–15:30 JST), separated by a one-hour midday break. The official market close concludes with a closing auction from 15:25 to 15:30 JST. Japanese cash equities generally settle on a T+2 cycle under Japan Securities Clearing Corporation (JSCC) rules.
Tokyo Stock Exchange Daily Trading Schedule (JST / UTC+9):
- 08:00 – 09:00 JST (Morning Order Acceptance): Orders can be entered ahead of the morning opening auction.
- 09:00 JST (Morning Opening Auction): The morning session begins with an opening auction for eligible securities.
- 09:00 – 11:30 JST (Morning Continuous Trading): Continuous auction trading takes place on strict Price/Time priority.
- 11:30 – 12:30 JST (Midday Intermission): No auction trading takes place during the one-hour break.
- 12:30 – 15:25 JST (Afternoon Continuous Trading): Continuous auction trading resumes across the Prime, Standard, and Growth segments.
- 15:25 – 15:30 JST (Closing Auction Session): A five-minute pre-closing order-acceptance period is followed by the closing auction at 15:30 JST.
Price Discovery Mechanisms:
- Daily Price Limits: TSE applies predefined upper and lower price limits to individual stocks to moderate extreme short-term price movements. These are price boundaries rather than a market-wide circuit breaker, and the applicable limits can be broadened under specified conditions.
- Special Quotes: When order imbalance prevents a normal transaction at a new price, TSE can display a special quote to facilitate orderly price discovery rather than immediately executing at an abrupt price dislocation.
Benchmark Variations: Nikkei 225 vs. TOPIX vs. JPX-Nikkei 400
Quick Answer: What Is the Difference Between the Nikkei 225, TOPIX, and JPX-Nikkei 400?
The Nikkei 225 is a modified price-weighted index tracking 225 blue-chip Prime Market stocks. TOPIX is a free-float market-capitalization-weighted index serving as the broad institutional benchmark across the TSE. The JPX-Nikkei 400 is an efficiency-focused benchmark screening companies for return on equity (ROE) and corporate governance.
| Benchmark Dimension | Nikkei Stock Average | TOPIX Index | JPX-Nikkei 400 Index |
| Constituent Count | Exactly 225 | Broad Japanese equity universe; methodology transition underway | Exactly 400 |
| Weighting Method | Modified Price-Weighted | Free-Float Market Cap | Free-Float MCap (1.5% Cap) |
| Exchange Scope | TSE Prime Market only | TSE Prime, Standard & Growth | TSE Prime, Standard & Growth |
| Primary Use Case | Market Barometer, Derivatives | Institutional Mandates, Pension Funds | Smart Beta, Capital Efficiency |
| Sector Allocation | Six Balanced Sectors | Market Cap Proportional | Quantitative Quality Screened |
| Rebalancing Cycle | Semi-Annual (April & October) | Transition begins October 2026; annual October reviews after full implementation | Annual (August) |
How to Gain Exposure to the Japan Nikkei 225
Quick Answer: How Do Investors Invest in Japanese Equities?
Domestic investors access the market through Japan-listed ETFs (such as code 1321). International investors can use Japan-equity ETFs such as EWJ for broad Japanese equity exposure, or use products specifically linked to the Nikkei 225, including exchange-cleared Nikkei 225 Futures traded on the Osaka Exchange (JPX), Singapore Exchange (SGX), or Chicago Mercantile Exchange (CME).
+---------------------------------------------------------------------------------------------------+
|                        JAPAN NIKKEI 225 INVESTMENT & TRADING ACCESS ROUTES                        |
+---------------------+-----------------------------+-----------------------+-----------------------+
| ACCESS VEHICLE      | TICKER EXAMPLES             | TRADING VENUE         | TARGET INVESTOR       |
+---------------------+-----------------------------+-----------------------+-----------------------+
| **Japan-Listed      | NEXT FUNDS Nikkei 225 ETF   | Tokyo Stock Exchange  | Domestic Japanese     |
| Nikkei 225 ETF**    | (Code: `1321`)              | (Traded in JPY)       | institutions & retail |
+---------------------+-----------------------------+-----------------------+-----------------------+
| **Broad Japan       | iShares MSCI Japan ETF      | NYSE Arca             | International allocators|
| Equity ETF**        | (Ticker: `EWJ`)             | (Traded in USD)       | seeking broad exposure|
+---------------------+-----------------------------+-----------------------+-----------------------+
| **Domestic Index    | Nikkei 225 Futures / Mini   | Osaka Exchange (OSE)  | Institutional hedgers,|
| Futures**           | (JPX product codes)         | (Traded in JPY)       | quantitative funds    |
+---------------------+-----------------------------+-----------------------+-----------------------+
| **Offshore Index    | SGX Nikkei 225 Index Futures| Singapore Exchange    | International macro   |
| Futures**           | (SGX contract code)         | (Traded in JPY / USD) | allocators, hedgers   |
+---------------------+-----------------------------+-----------------------+-----------------------+
Comparative Analysis: Nikkei 225 vs. Global Equity Benchmarks
Quick Answer: How Does the Nikkei 225 Compare to the S&P 500, DAX 40, and CSI 300?
The Nikkei 225 is defined by its price-weighted methodology and heavy concentration in electronics, technology hardware, and automotive exports, distinguishing it from market-cap-weighted international peers.
| Dimension / Metric | Japan Nikkei 225 | USA S&P 500 | Germany DAX 40 | China CSI 300 |
| Constituent Count | Exactly 225 | 500 Large-Cap US firms | 40 Major German firms | Exactly 300 companies |
| Weighting Method | Modified Price-Weighted | Float-Adjusted MCap | Free-Float MCap | Category-Float MCap |
| Primary Currency | Japanese Yen (JPY) | US Dollar (USD) | Euro (EUR) | Chinese Yuan (CNY) |
| Common Return Standard | Price Return | Price Return | Performance (Total Return) | Price Return |
| Top Sector Bias | Technology & Consumer | Information Technology | Industrials & Autos | Information Technology |
| Standard Settlement | T+2 | T+1 | T+2 | T+1 |
| Midday Break? | Yes (11:30 – 12:30 JST) | None (Continuous) | None (Continuous) | Yes (11:30 – 13:00 CST) |
| Closing Time | 15:30 JST | 16:00 ET | 17:30 CET | 15:00 CST |
Common Myths vs. Empirical Facts
- Myth: The Nikkei 225 and TOPIX are virtually identical.
- Fact: The Nikkei 225 is a modified price-weighted index tracking 225 liquid companies on the TSE Prime Market. TOPIX is a free-float market-capitalization index tracking a broader universe across Prime, Standard, and Growth segments.
- Myth: A weaker yen always leads to a higher Nikkei 225.
- Fact: While a weaker yen generally supports export profit translation, the net market reaction depends on energy import costs, broader supply chain inflation, interest rate expectations, and global demand conditions.
- Myth: The Tokyo Stock Exchange closes trading at 15:00.
- Fact: Following the Tokyo Stock Exchange trading-hours extension, regular cash equity continuous trading runs until 15:25 JST, followed by a dedicated closing auction from 15:25 to 15:30 JST.
- Myth: The Nikkei 225 rebalances only once per year in October.
- Fact: Under official Nikkei Inc. methodology, periodic constituent reviews take place twice a year, with adjustments becoming effective in April and October.
Frequently Asked Questions
What does “Nikkei” stand for in Japanese finance?
Nikkei refers to Nikkei Inc. (Nihon Keizai Shimbun), the preeminent Japanese financial media group that owns, calculates, and administers the Nikkei Stock Average benchmark.
Can international investors access the Nikkei 225?
Yes. Global investors access the market through domestic brokerage accounts using Japan-listed ETFs (such as code 1321), offshore vehicles such as U.S.-listed Japan funds (EWJ), or Nikkei 225 futures traded on the Osaka Exchange, SGX, and CME.
How often is the Nikkei 225 rebalanced?
Nikkei Inc. conducts periodic constituent reviews twice a year, with changes generally taking effect on the first trading day of April and October, with regular periodic additions and deletions capped at three stocks per review.
Is the Nikkei 225 a price return or total return index?
The headline Nikkei 225 is a Price Return index. A separate Nikkei 225 Total Return Index accounts for the mathematical reinvestment of cash dividends.
What are the trading hours of the Tokyo Stock Exchange?
The TSE cash equity market operates from 09:00 to 11:30 JST (morning session) and 12:30 to 15:30 JST (afternoon session), concluding with a closing auction between 15:25 and 15:30 JST.
Strategic Summary & Core Takeaways
- Japan’s Headline Benchmark: The Nikkei 225 is one of Japan’s best-known equity benchmarks, tracking 225 highly liquid companies listed on the TSE Prime Market.
- Modified Price-Weighting: Unlike free-float market-capitalization-weighted benchmarks, the Nikkei 225 uses a modified price-weighted methodology based on adjusted constituent prices, Price Adjustment Factors (PAFs), and the Nikkei Divisor.
- Sector Composition: The index is heavily weighted toward Technology and Consumer Goods, reflecting the global footprint of Japan’s precision manufacturing, robotics, and semiconductor equipment sectors.
- Currency Transmission: Equity performance is sensitive to yen movements, particularly through the earnings and valuation effects on globally exposed Japanese companies.
- Modernized Trading Microstructure: The Tokyo Stock Exchange operates morning and afternoon sessions concluding with a 15:25–15:30 JST closing auction, while constituent reviews take place semi-annually in April and October.
Next Reading Suggestions
- USA S&P 500: The Complete Guide to Index Methodology, Market-Cap Weighting, and Global Market Mechanics
- China Shanghai CSI: The Complete Guide to the CSI 300 Index, Methodology, and China A-Share Market Structure
- Australia ASX 200: The Complete Guide to the S&P/ASX 200 Index, Methodology, and Market Structure
- Germany DAX 40: The Complete Guide to Components, Total Return Methodology, and Global Market Mechanics
- Canada TSX: The Complete Guide to the S&P/TSX Composite Index, Methodology, and Market Structure
- Dubai Financial Market (DFM): The Complete Guide to the DFMGI Index, Methodology, and Market Structure
- How Stock Prices Are Determined: Market Microstructure, Supply and Demand, and Valuation
- What Is Market Capitalization? The Complete Guide to Market Cap, Company Size, and Valuation
- Interest Rates and Exchange Rates: The Complete Guide to Global Currency Pricing
- Fed Rate Cuts & Global Liquidity: The Complete Guide to Interest Rates, the Fed Balance Sheet, and Asset Markets
Author Box & E-E-A-T Verification
Written & Researched By: CurrencyPlans Editorial Research Team
Editorial Review & Methodological Standards: This Japanese capital-market guide is developed using primary index methodology, exchange operating rules, regulatory publications, and official market-data sources. Key areas reviewed include Nikkei 225 constituent selection, price-weighted calculation, Divisor and Price Adjustment Factor mechanics, TSE trading rules, TOPIX methodology, and Japanese monetary-policy frameworks.
Educational References & Market Data Sources
For official index rulebooks, constituent announcements, and trading schedules, consult primary regulatory and exchange portals directly:
- Nikkei Indexes (Official Portal): Nikkei 225
- Tokyo Stock Exchange (Official JPX Portal): Japan Exchange Group (JPX)
- Bank of Japan (Monetary Policy & Economic Data): Bank of Japan
- Japan Securities Clearing Corporation (JSCC Settlement Rules): JSCC
- Financial Services Agency of Japan (FSA Regulatory Supervision): FSA
Educational Disclaimer
This guide is prepared strictly for educational, research, and informational purposes and does not constitute personalized financial, investment, trading, or tax advice. Equities, regional indices, and cross-currency instruments carry market risks. Past performance of the Nikkei 225 does not guarantee future financial returns. Always conduct independent research and consult a licensed fiduciary advisor before allocating investment capital.

