
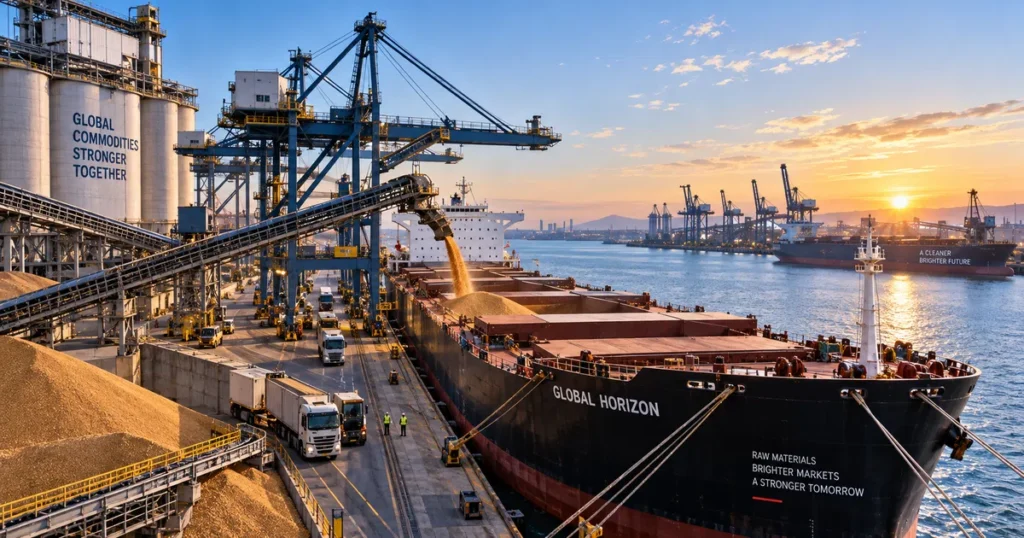
Commodities represent the foundational physical building blocks of the modern global economy. From the crude oil powering transcontinental transport to the wheat sustaining populations and the copper wiring industrial electrification, commodities comprise basic, fungible raw materials that are extracted, harvested, or processed for industrial and consumer consumption.
Unlike corporate equities, which derive value from enterprise earnings, cash flows, and management execution, commodity pricing is strongly influenced by physical supply and demand, transportation logistics, storage costs, inventory conditions, financial conditions, and marginal production economics. Traded across centralized exchanges like the Chicago Mercantile Exchange (CME), the London Metal Exchange (LME), and the Intercontinental Exchange (ICE), commodities constitute a multi-trillion-dollar asset class. Understanding this market requires analyzing the structural behavior of futures forward curves, the mechanics of contango and backwardation, the real yield of storage arbitrage, and the role raw materials play as inflation hedges within multi-asset portfolios, complementing foundational valuation principles detailed in our guide on how stock prices are determined.
Executive Summary: Physical Real Assets vs. Financial Claims
Quick Answer: What Are Commodities and Commodity Markets?
Commodities are raw, standardized, fungible physical materials that can be bought, sold, or exchanged on open markets. They are categorized into Hard Commodities (natural resources that are extracted or mined, including energy products and metals) and Soft Commodities (agricultural products and livestock that are grown, farmed, or ranched, such as wheat, coffee, and live cattle). Commodity markets are institutional marketplaces where producers, commercial consumers, and financial investors trade standardized contracts for physical delivery or financial settlement.
The institutional taxonomy of global assets illustrates the unique positioning of physical commodities relative to paper claims:
                          ┌──────────────────────────────────────────────┐
                          │         GLOBAL INVESTABLE ASSET CLASSES      │
                          └──────────────────────┬───────────────────────┘
                                                 │
         ┌───────────────────────────────────────┴───────────────────────────────────────┐
         │                                                                               │
         ▼                                                                               ▼
┌────────────────────────────────────────┐                     ┌────────────────────────────────────────┐
│ FINANCIAL ASSETS (PAPER CLAIMS)        │                     │ REAL ASSETS (PHYSICAL ECONOMIC GOODS)  │
├────────────────────────────────────────┤                     ├────────────────────────────────────────┤
│ * Public Equities (Corporate Earnings) │                     │ * Commodities (Raw Physical Materials) │
│ * Fixed Income (Contractual Debt Yield)│                     │ * Real Estate (Land & Physical Built)  │
│ * Fiat Currencies (Sovereign Credits)  │                     │ * Infrastructure (Pipelines, Grids)    │
│ * Intangibles (Software, Patents)      │                     │ * Natural Resources (Timber, Reserves) │
└───────────────────┬────────────────────┘                     └───────────────────┬────────────────────┘
                    │                                                              │
                    └──────────────────────────────┬───────────────────────────────┘
                                                   │
                                                   ▼
                    ┌─────────────────────────────────────────────────────────────┐
                    │ THE CORE DIVERGENCE: VALUE DRIVERS                          │
                    ├─────────────────────────────────────────────────────────────┤
                    │ * Equities: Valued via discounted future cash flows (DCF)   │
                    │ * Commodities: Governed by physical supply-demand balance,  │
                    │   storage capacity, weather, freight, and production costs  │
                    └─────────────────────────────────────────────────────────────┘
The commodity investment paradigm operates on three core structural principles:
- Fungibility and Standardization: Every unit of a specific grade must be mutually interchangeable regardless of who produced it. One barrel of West Texas Intermediate (WTI) crude meeting API gravity and sulfur specifications is chemically equivalent to another conforming delivery.
- Matched Long and Short Positions: Futures contracts are matched one-for-one between long and short positions; economically, the gain of one side is generally offset by the loss of the other before transaction fees and carrying costs. Unlike corporations that issue equity shares that represent ongoing enterprise claims, futures derivatives have zero net contract issuance.
- Cost of Carry and Physical Friction: Financial assets can be stored electronically at negligible cost. Physical commodities require real-world capital: insulated storage tanks, grain elevators, insurance policies, marine transport charters, and financing costs. These physical constraints directly dictate pricing along the futures term structure.
The Historical Evolution: From Ancient Storehouses to Electronic Exchanges
Quick Answer: How Did Commodity Markets Develop?
Commodity trading originated thousands of years ago through storehouse receipts and commercial records in antiquity. Modern organized futures trading emerged through developments such as the Dojima Rice Exchange in Japan and the formal establishment of the Chicago Board of Trade (CBOT) in 1848, which introduced standardized contracts to address seasonal agricultural price volatility.
The operational history of commodity markets tracks humanity’s commercial development:
- Ancient Commercial Records (c. 3000 BCE): In ancient Mesopotamia and classical antiquity, agricultural storehouses issued records documenting ownership, quantities, deliveries, debts, and commercial obligations, providing early historical evidence of organized commodity trade and storage.
- 1697 (Dojima Rice Exchange, Osaka): Japanese rice merchants developed an organized market for rice contracts that became an important precursor to modern futures trading. Merchants traded claims on future rice harvests using standardized forward contracts with daily settlement procedures.
- 1848 (Formation of the CBOT): Midwest American grain farmers faced severe logistics bottlenecks in Chicago: bumper harvests triggered steep autumn price drops, while springtime shortages caused commercial supply strains. Eighty-two merchants formed the Chicago Board of Trade (CBOT) to standardize forward delivery dates, grading quality, and counterparty performance bonds.
- 1877 (The London Metal Exchange): As Britain’s Industrial Revolution demanded imported copper, lead, and tin supplies, London merchants established the LME, trading physical deliveries to manage transport lead times from global mining basins.
- 1970s (The End of Bretton Woods & Energy Volatility): The conclusion of fixed dollar-gold convertibility in August 1971, combined with the 1973 OPEC oil embargo, accelerated the development of modern energy futures on venues such as the New York Mercantile Exchange (NYMEX).
- 2000s–Present (Electronic Clearing & Institutional Indexing): The transition from open-outcry trading pits to continuous electronic matching engines expanded global participation. Modern institutions access commodity exposure through diversified indices like the S&P GSCI and Bloomberg Commodity Index (BCOM), cleared via centralized clearing houses (CCPs).
Structural Classification: Hard vs. Soft Commodities
Quick Answer: What Is the Difference Between Hard and Soft Commodities?
Hard Commodities generally refer to natural resources that are extracted or mined, including energy products (crude oil, natural gas) and metals (copper, gold, iron ore). They often involve capital-intensive production cycles. Soft Commodities are agricultural products or livestock that are grown, farmed, or ranched (wheat, soybeans, coffee, live cattle). They are subject to biological growth constraints, weather cycles, and seasonal harvest periods.
The primary commodity complexes are systematically divided across five distinct economic segments:
+---------------------------------------------------------------------------------------------------+
|                            THE 5 CORE GLOBAL COMMODITY COMPLEXES                                  |
+---------------------+-----------------------------+-----------------------+-----------------------+
| COMPLEX             | REPRESENTATIVE ASSETS       | DOMINANT PRICING VENUE| PRIMARY MACRO DRIVERS |
+---------------------+-----------------------------+-----------------------+-----------------------+
| **Energy**          | WTI Crude, Brent, Heating   | NYMEX, ICE Europe     | Geopolitics, OPEC+    |
| (Hard)**            | Oil, RBOB Gasoline, Gasoil  |                       | quotas, global GDP    |
+---------------------+-----------------------------+-----------------------+-----------------------+
| **Industrial /      | Copper, Aluminum, Nickel,   | LME, COMEX, SHFE      | Grid infrastructure,  |
| Base Metals (Hard)**| Zinc, Lead, Tin             | (Shanghai)            | manufacturing, EVs    |
+---------------------+-----------------------------+-----------------------+-----------------------+
| **Precious Metals** | Gold, Silver, Platinum,     | COMEX, LBMA (London   | Real interest rates,  |
| (Hard)**            | Palladium                   | OTC Physical)         | USD, central banks    |
+---------------------+-----------------------------+-----------------------+-----------------------+
| **Agriculture /     | Corn, Soybeans, Wheat,      | CBOT (CME Group),     | Weather (El Niño),    |
| Grains (Soft)**     | Soybean Oil, Soybean Meal   | Euronext              | fertilizer, acreage   |
+---------------------+-----------------------------+-----------------------+-----------------------+
| **Softs & Livestock | Coffee, Cocoa, Sugar,       | ICE US, CME Group     | Tropical weather, feed|
| (Soft)**            | Cotton, Live Cattle, Hogs   |                       | grain prices, disease |
+---------------------+-----------------------------+-----------------------+-----------------------+
1. Hard Commodities: Extraction and Capital Cycles
Hard commodities require substantial upfront capital expenditures (CapEx) to explore, develop, and construct mining shafts or offshore drilling platforms. Because opening a new copper mine or deepwater oilfield often requires years of engineering and permitting, primary supply response can be relatively inelastic over short horizons. When unexpected demand surges occur, immediate physical supply constraints can lead to sharp pricing adjustments.
2. Soft Commodities: Seasonality and Biological Factors
Soft commodities depend on annual planting cycles and regional climate patterns. Weather anomalies, droughts, unseasonal freezes, and agricultural diseases directly impact seasonal yields. Unlike refined metals, agricultural products face storage limits and natural perishability over extended periods, requiring temperature and humidity controls that add to ongoing physical carry costs.
Market Microstructure: Spot Markets vs. Futures Term Structure
Quick Answer: What Is the Difference Between Spot and Futures Markets?
The Spot Market (Cash Market) involves transactions for a physical commodity at or near the current market price, with delivery and payment according to the terms and conventions of the relevant physical market. The Futures Market involves standardized, exchange-traded contracts agreeing to buy or sell a specified quantity and grade of a commodity at a predetermined price for a designated future delivery month.
The structural relationship between spot and futures prices is governed by the Futures Term Structure—the curve plotting futures contract prices across consecutive delivery months:
Price ($)
  ▲
  │                                      CONTANGO (Futures > Spot)
  │                                     ┌─────────────────────────
  │                                ┌───┘  Upward-sloping curve:
  │                           ┌───┘       Financing and storage carry
  │                      ┌───┘
  ├─────────────────┬───┘
  │  SPOT PRICE     │
  ├─────────────────┴───┐
  │                      └───┐
  │                           └───┐       BACKWARDATION (Spot > Futures)
  │                                └───┐  Downward-sloping curve:
  │                                     └─────────────────────────
  │                                       Immediate physical demand / scarcity
  └─────────────────────────────────────────────────────────────────► Time to Expiration
The Concept of Basis
In physical commodity commerce, the difference between the local cash spot price and the relevant benchmark futures price is defined as the Basis:
$$\text{Basis} = \text{Spot Price} – \text{Futures Price}$$
- Strengthening Basis: When the spot price rises relative to the futures price, the basis strengthens, often reflecting localized inventory demand or transit disruptions.
- Weakening Basis: When the spot price declines relative to the futures price, the basis weakens, reflecting local inventory accumulation or harvest inflows.
The Cost of Carry Model: Spot Prices, Storage, and Convenience Yield
Quick Answer: What Governs the Relationship Between Spot and Futures Prices?
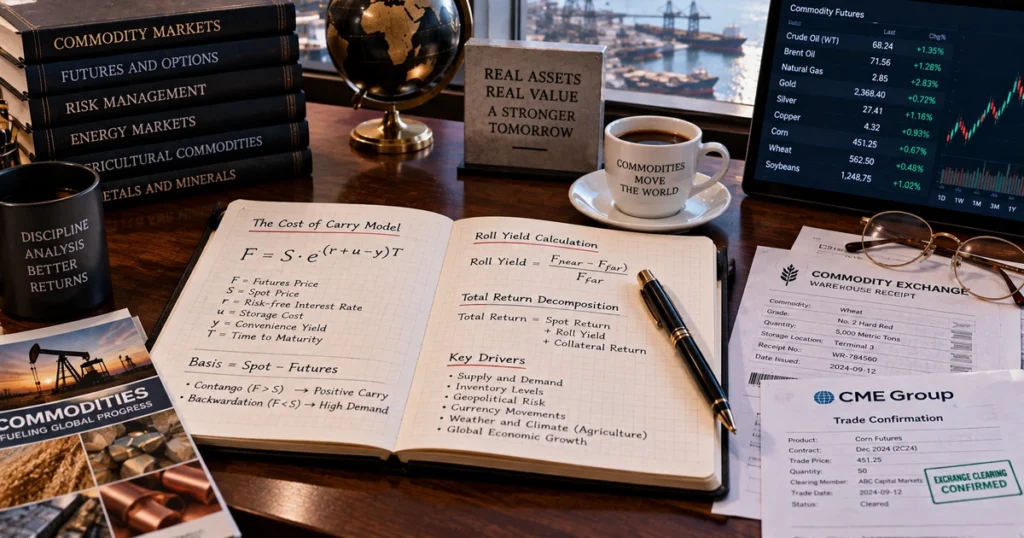
The relationship between spot and futures prices is described by the Cost of Carry Model, documented in the educational materials of major venues like CME Group. The cost of carry incorporates the financing rate (interest paid to finance inventory), physical storage charges, and insurance costs, offset by the Convenience Yield—the operational benefit of holding physical inventory on hand rather than a derivative contract.
Under continuous-time compounding, the theoretical forward price $F(t, T)$ for delivery at time $T$ can be modeled as:
$$F(t, T) = S(t) \cdot e^{(r + u – y)(T – t)}$$
Where:
- $S(t)$ is the prevailing spot price of the physical commodity.
- $r$ is the financing interest rate.
- $u$ is the storage and insurance cost rate.
- $y$ is the Convenience Yield, reflecting the commercial value of having immediate physical inventory available during unexpected supply disruptions.
- $(T – t)$ represents the time duration remaining until delivery.
Theoretical Bounds: Cash-and-Carry Arbitrage
The cost-of-carry framework provides theoretical arbitrage relationships, although real-world market frictions can prevent prices from converging exactly to theoretical bounds:
- Cash-and-Carry Arbitrage (Upper Bound): If the futures price trades significantly above the cost of carry ($F > S \cdot e^{(r+u)(T-t)}$), a physical arbitrageur can:
- Borrow funds at financing rate $r$.
- Purchase the physical commodity in the spot market at price $S$.
- Incur storage and insurance costs $u$.
- Simultaneously sell (short) the futures contract at $F$.Upon expiration, the arbitrageur delivers the physical inventory into the contract, locking in a theoretical arbitrage margin before transaction, financing, storage, and delivery costs. This commercial selling creates an upper boundary for the forward curve.
- Limits to Reverse Cash-and-Carry:If the futures price trades below fair value, theoretical arbitrage involves shorting physical spot inventory and purchasing futures. However, because physical commodities cannot always be easily borrowed or shorted during severe shortages, physical storage capacity and financing constraints can limit the extent to which arbitrage can force futures prices back toward theoretical fair-value relationships.
Contango vs. Backwardation and Roll Yield Mechanics
Quick Answer: What Are Contango, Backwardation, and Roll Yield?
Contango occurs when futures prices are higher than current spot prices, producing an upward-sloping forward curve. Backwardation occurs when futures prices are lower than current spot prices, producing a downward-sloping forward curve. Roll yield refers to the gain or loss associated with replacing an expiring futures contract with a later-dated contract.
The structural attributes of forward curve geometries determine roll dynamics:
+---------------------------------------------------------------------------------------------------+
|                                CONTANGO VS. BACKWARDATION OVERVIEW                                |
+---------------------+-----------------------------+-----------------------+-----------------------+
| PARAMETER           | CONTANGO (UPWARD-SLOPING)   | BACKWARDATION (INVERTED)| STRUCTURAL CONTEXT  |
+---------------------+-----------------------------+-----------------------+-----------------------+
| **Curve Shape**     | Upward-sloping ($F_1 < F_2$) | Downward-sloping ($F_1 > F_2$)| Term structure path   |
| **Spot vs. Futures**| Spot < Futures Prices       | Spot > Futures Prices | Inventory availability|
| **Physical Context**| Ample physical inventories  | Immediate physical demand| Physical tightness    |
| **Convenience Yield**| Low or negligible ($y \approx 0$)| High convenience ($y > r+u$)| Value of inventory    |
| **Roll Contribution**| **Negative Roll Drag**     | **Positive Roll Contribution**| Impact on rolling funds|
+---------------------+-----------------------------+-----------------------+-----------------------+
(Note: In simplified pricing models, backwardation corresponds to conditions where the convenience yield $y$ approximately exceeds the carrying costs $r + u$.)
Illustrative Roll Yield Relationship
When institutional index funds maintain exposure through futures contracts without taking physical delivery, they periodically roll positions by selling expiring front-month contracts and buying longer-dated contracts. A simplified measure of the price difference between expiring and replacement contracts can be expressed as:
$$\text{Roll Yield} \approx \frac{F_{\text{front}} – F_{\text{deferred}}}{F_{\text{deferred}}}$$
- The Contango Drag: In an upward-sloping contango market, an investor sells lower-priced expiring contracts ($F_{\text{front}}$) to purchase higher-priced subsequent contracts ($F_{\text{deferred}}$). Over time, this recurring roll drag can weigh on the total return of futures-based investment products relative to the underlying spot price.
- The Backwardation Effect: In a downward-sloping backwardated market, an investor rolls out of higher-priced expiring contracts into cheaper deferred contracts, potentially generating a positive roll contribution even when spot prices are relatively stable.
The Major Commodity Complexes in Detail
1. The Energy Complex: Crude Oil, Refined Products, and Natural Gas
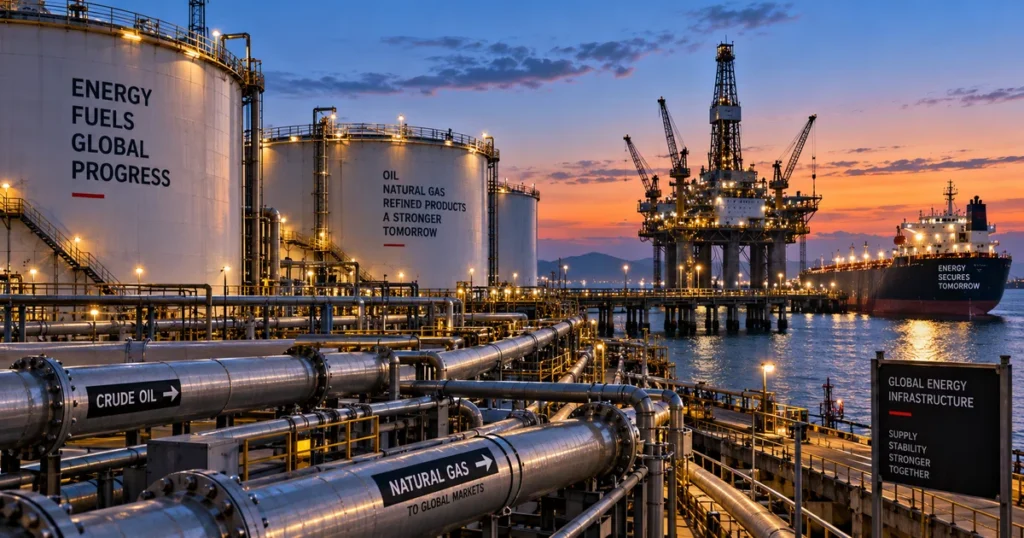
Energy markets represent the largest volume segment of international commodity trade:
- Crude Oil (WTI vs. Brent): West Texas Intermediate (WTI) is a light, sweet crude benchmark physically deliverable at the pipeline infrastructure junction in Cushing, Oklahoma. Brent Crude serves as a major international seaborne benchmark for crude oil pricing, reflecting production and logistics across the North Sea and global waterborne markets.
- The Crack Spread: Petroleum refiners process raw crude into refined fuels like ultra-low sulfur diesel, heating oil, and gasoline. The 3:2:1 Crack Spread is an industry benchmark representing the theoretical refining margin derived from purchasing three barrels of crude oil to yield two barrels of gasoline and one barrel of distillate fuel.
- Natural Gas (Henry Hub vs. International Hubs): Traded primarily via Henry Hub pipeline connections in the U.S., while international liquefied natural gas (LNG) trades against regional pricing hubs such as Europe’s Title Transfer Facility (TTF). Natural gas exhibits distinct seasonal demand swings driven by winter heating needs and summer electricity generation.
2. Precious Metals: Monetary Stores of Value vs. Industrial Catalysts
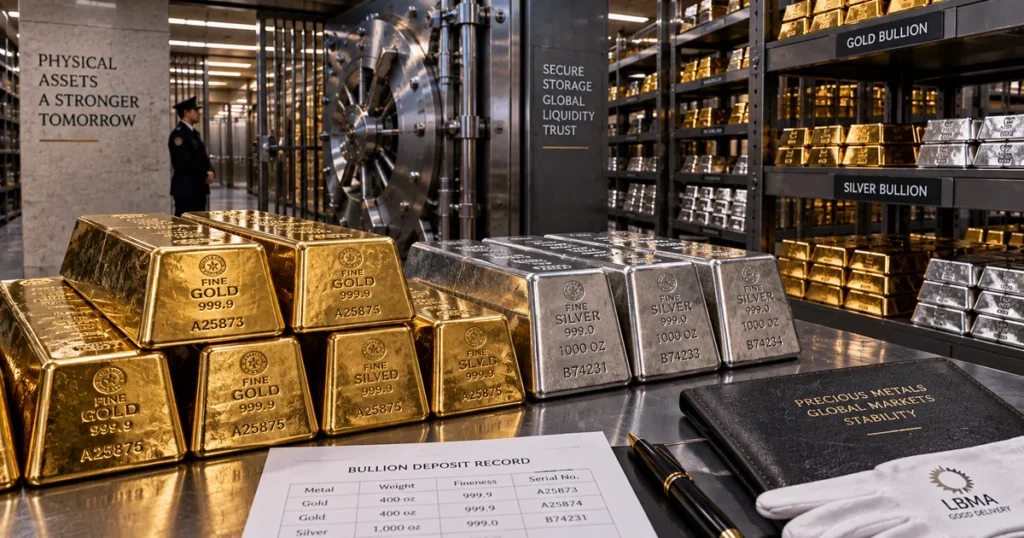
Precious metals combine monetary reserve characteristics with industrial demand:
- Gold: Traded globally through the London Over-The-Counter (OTC) market under London Bullion Market Association (LBMA) standards and on centralized derivatives venues like COMEX. Because gold is durable and largely preserved rather than consumed, it features a very high stock-to-flow ratio, functioning as an institutional reserve asset, explored in our dedicated guide on what is gold.
- Silver: Features substantial dual exposure as both an investment metal and an industrial input. Silver has a significant industrial role, particularly in photovoltaics, electronics manufacturing, automotive electrical components, and brazing alloys.
- Platinum and Palladium: Heavily utilized in automotive catalytic converters and industrial chemical catalysts, making their pricing sensitive to worldwide vehicle production trends.
3. Industrial and Base Metals: Infrastructure and Electrification
Base metals supply the physical materials required for construction and capital goods:
- Copper: Extensively used across electrical wiring, power generation, industrial machinery, and construction plumbing. The global transition toward renewable energy, grid expansion, and electric vehicles is expected to increase copper demand because these technologies require substantial electrical infrastructure and conductive materials.
- Aluminum: A lightweight metal produced by smelting alumina through energy-intensive electrolysis. Aluminum pricing is sensitive to regional electricity tariffs, automotive lightweighting trends, and aerospace manufacturing.
- Nickel and Zinc: Primary inputs for stainless steel manufacturing, energy storage chemistry, and the galvanization of structural steel against environmental corrosion.
4. Agricultural and Soft Commodities: Food Security and Climate Cycles
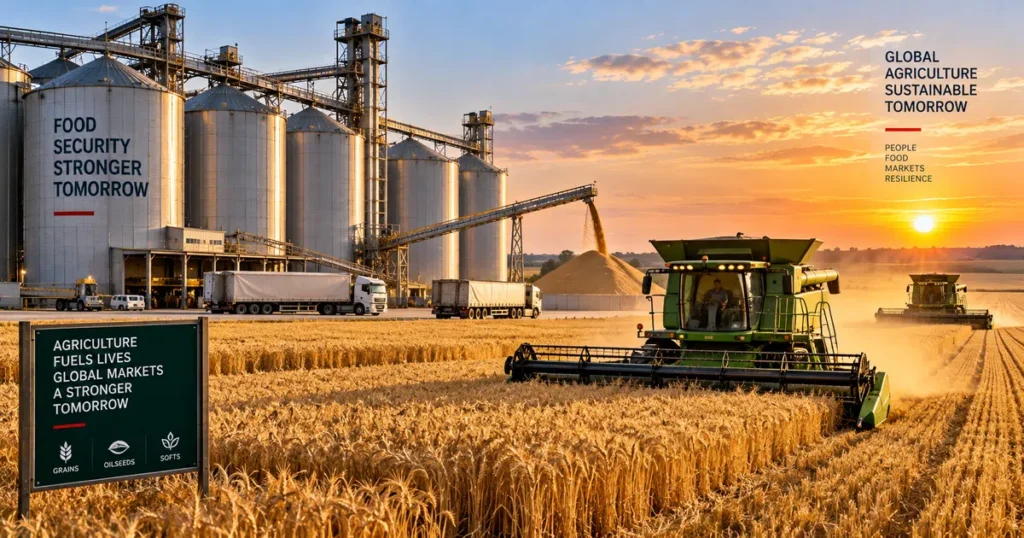
Agricultural commodities underpin global food supplies and livestock feed:
- Grains and Oilseeds (Corn, Soybeans, Wheat): Centered primarily on the Chicago Board of Trade. The Crush Spread measures the commercial processing margin of converting raw soybeans into soybean meal (livestock protein feed) and soybean oil (food production and biofuel feedstocks).
- Soft Commodities (Coffee, Cocoa, Sugar, Cotton): Tropical crops concentrated in specific climatic regions. Geographic production concentration in countries such as Brazil (coffee, sugar) and West Africa (cocoa) can lead to sharp pricing moves during regional droughts, plant diseases, or harvest disruptions.
Macroeconomic Drivers of Commodity Pricing
Quick Answer: What Macro Forces Drive Commodity Prices?
Commodity prices are driven by the US Dollar exchange rate, real interest rates, global industrial production, geopolitical supply bottlenecks, and physical inventory levels, linking directly to macroeconomic mechanics explored in our study oninterest rates and exchange rates.
                      ┌─────────────────────────────────────────┐
                      │    MACRO TRANSMISSION CHANNELS TO RAW   │
                      │               COMMODITIES               │
                      └────────────────────┬────────────────────┘
                                           │
         ┌─────────────────────────────────┴─────────────────────────────────┐
         │                                                                   │
         ▼                                                                   ▼
┌──────────────────────────────────┐               ┌──────────────────────────────────┐
│ MONETARY & CURRENCY FORCES       │               │ REAL-WORLD DEMAND & SUPPLY       │
├──────────────────────────────────┤               ├──────────────────────────────────┤
│ * US Dollar Relationship:        │               │ * Global Industrial Output:      │
│   Most global commodities are    │               │   Manufacturing expansion drives │
│   priced in USD; dollar swings   │   base metals and energy usage   │
│   impact foreign buying power    │ * Supply Shocks & Logistics:     │
│ * Real Interest Rates:           │   Transit bottlenecks and trade  │
│   Influence carrying costs and   │   policies can create supply     │
│   physical inventory financing   │   dislocations                   │
└──────────────────────────────────┘               └──────────────────────────────────┘
1. The US Dollar Relationship
Because international benchmark commodity contracts are denominated predominantly in US Dollars, movements in the dollar create a direct currency translation effect:
- A weaker US Dollar makes dollar-denominated raw materials relatively less expensive for international buyers holding other currencies, which can support global physical demand.
- A stronger US Dollar increases import costs in local currency terms for consuming nations, which can exert downward pressure on dollar-quoted commodity benchmarks.
2. Real Interest Rates and Inventory Financing
Nominal interest rates adjusted for inflation influence physical inventory economics:
- Higher real interest rates increase the financing cost ($r$) in the cost of carry equation, encouraging commercial consumers and trade merchants to optimize inventory levels and reduce debt-financed physical stockpiles.
- Lower or negative real interest rates reduce the opportunity cost of holding non-yielding tangible assets, which can support demand for durable physical commodities, dynamics analyzed in our research on fed rate cuts and global liquidity.
3. Geopolitical Events and Shipping Logistics
Because natural resources are geographically concentrated, distribution logistics play a crucial role in price stability:
- Transit through critical maritime channels—such as the Strait of Hormuz, the Suez Canal, and the Strait of Malacca—can introduce shipping risk premiums during regional conflicts.
- Export tariffs, trade restrictions, and sovereign production quotas can alter global trade flows and shift physical delivery patterns across major consuming regions.
Trading Mechanics: Physical Delivery, Cash Settlement, and Clearing Houses
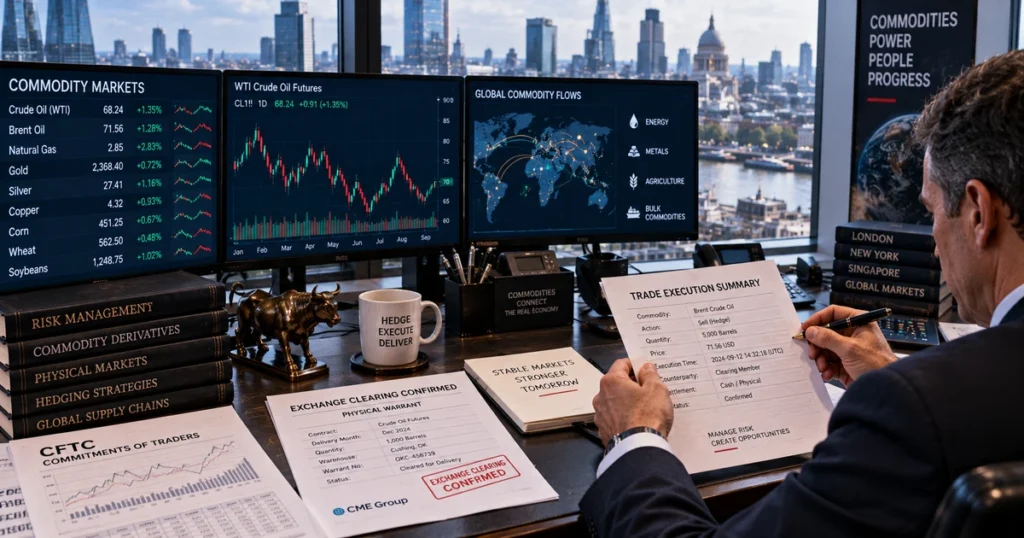
Quick Answer: How Do Commodity Futures Settle at Expiration?
Commodity futures settle via either Physical Delivery or Cash Settlement. Under physical delivery, buyers and sellers settle through the transfer of legal title to goods stored in exchange-approved facilities via a Warehouse Receipt (Warrant). Under cash settlement, no physical goods are delivered; instead, accounts are credited or debited based on the final contract settlement price.
1. Physical Delivery Mechanics
For physically deliverable contracts, market participants holding positions past expiration deadlines enter the delivery process:
- The seller issues an exchange notice of intention to deliver, specifying approved warehouse or terminal facilities. For benchmark contracts such as NYMEX Light Sweet Crude Oil, physical delivery is executed at designated pipeline and storage manifolds in Cushing, Oklahoma.
- The clearing house matches the delivery notice with an eligible long position holder.
- Legal title is transferred through an official warehouse warrant, with the buyer paying the final settlement amount and assuming subsequent physical storage and handling charges.
2. Central Counterparty Clearing Houses (CCPs)
Central counterparty clearing houses (such as CME Clearing and LME Clear) manage counterparty risk in derivatives trading:
- Novation: The clearing house acts as the central counterparty to every executed trade, becoming the buyer to every seller and the seller to every buyer.
- Margin Frameworks: Clearing participants maintain Initial Margin as performance collateral and settle Variation Margin daily based on mark-to-market valuations, mitigating systemic default risks.
3. The CFTC Commitments of Traders (COT) Report
Published weekly by the U.S. Commodity Futures Trading Commission (CFTC), the Commitments of Traders (COT) report breaks down open interest across distinct market participants:
- Commercial Traders: Producers, processors, and merchants who use futures contracts primarily to hedge physical inventory and forward sales.
- Non-Commercial Traders: Institutional asset managers, hedge funds, and trading advisors participating for portfolio diversification and investment returns.
- Managed Money: Monitored by analysts as a gauge of speculative positioning trends and capital flows within specific commodity derivatives.
How to Gain Exposure to Commodities: Investment Vehicles
Quick Answer: How Do Investors Gain Commodity Exposure?
Investors gain exposure through four primary pathways: Direct Physical Ownership (bullion and other eligible physical commodities), Commodity Exchange-Traded Products (ETPs), Natural Resource Equities (mining, energy, and agribusiness companies), and exchange-traded Futures and Options Contracts.
+---------------------------------------------------------------------------------------------------+
|                            COMMODITY INVESTMENT ACCESS PATHWAYS                                   |
+---------------------+-----------------------------+-----------------------+-----------------------+
| ACCESS PATHWAY      | REPRESENTATIVE EXAMPLES     | PRIMARY ATTRIBUTES    | STRUCTURAL CONSIDERATIONS |
+---------------------+-----------------------------+-----------------------+-----------------------+
| **Physical Bullion  | Gold and silver bullion;    | Direct title; no      | Incurs secure storage |
| & Eligible Goods**  | allocated depository storage| corporate credit risk | and insurance fees    |
+---------------------+-----------------------------+-----------------------+-----------------------+
| **Commodity ETPs    | Physically backed trusts;   | Traded through regular| Futures-based products|
| (Trusts & Funds)**  | futures-based products      | brokerage accounts    | subject to roll yield |
+---------------------+-----------------------------+-----------------------+-----------------------+
| **Natural Resource  | BHP Group, Rio Tinto,       | Operational leverage; | Equity market beta;   |
| Producer Equities** | ExxonMobil, mining stocks   | dividend distributions| operating cost risks  |
+---------------------+-----------------------------+-----------------------+-----------------------+
| **Exchange Futures  | CME, NYMEX, ICE, and LME    | Direct curve exposure;| Leverage requirements;|
| & Options**         | standardized contracts      | high liquidity        | margin management     |
+---------------------+-----------------------------+-----------------------+-----------------------+
The Role of Natural Resource Equities
Investing in mining or energy equities—such as major producers listed on exchanges including the Australian Securities Exchange (ASX) and Toronto Stock Exchange (TSX)—provides indirect exposure to underlying commodity prices through corporate earnings:
- Higher realized sales prices can expand corporate operating margins when extraction costs remain controlled.
- Resource equities also involve equity market risk, management execution risk, regulatory permitting variables, and input-cost inflation, factors explored in our review of the USA S&P 500.
Comparative Analysis: Commodities vs. Equities, Bonds, and Real Estate
Quick Answer: How Do Commodities Differ from Traditional Asset Classes?
Unlike stocks (corporate ownership) and bonds (debt claims), physical commodities generate no contractual dividends or coupon interest. Their investment returns derive from spot price appreciation, futures curve roll yield contributions, and collateral yields earned on cash reserves backing derivatives.
| Dimension / Asset Class | Physical Commodities | Public Equities (Stocks) | Government Bonds | Commercial Real Estate |
| Asset Category | Physical Real Assets | Corporate Equity Claims | Sovereign Debt Contracts | Physical Built Property |
| Contractual Yield | No Contractual Income | Discretionary Dividends | Contractual Coupon Yield | Contractual Rental Income |
| Primary Valuation Basis | Supply-Demand & Carry | Discounted Cash Flow (P/E) | Yield to Maturity (YTM) | Capitalization Rate (Cap) |
| Inflation Sensitivity | Often Sensitive | Variable by Industry | Often Negatively Affected | Inflation-Linked Leases |
| Economic Cycle Beta | Often Cyclical | Cyclical / Growth | Counter-Cyclical | Cyclical / Real Growth |
| Key Risk Factors | Storage, Contango, Logistics | Corporate Earnings Risk | Duration & Rate Risk | Occupancy & Tenant Risk |
Common Myths vs. Empirical Facts
- Myth: Buying a commodity ETP is always identical to holding the physical spot commodity.
- Fact: Physically backed precious metals trusts hold allocated metal, but many broad-market commodity products utilize futures contracts. Over time, returns in futures-based products are influenced by the forward curve structure (contango drag or backwardation tailwinds), causing performance to diverge from spot price movements.
- Myth: Higher commodity spot prices automatically guarantee expanding profits for mining firms.
- Fact: Resource producers face operating costs including fuel, electricity, mining machinery, and labor. If input-cost inflation rises at the same pace as commodity sales prices, corporate profit margins may remain flat or compress.
- Myth: Commodities provide an absolute hedge against every inflationary episode.
- Fact: While commodities often perform well during resource-driven inflation, specific commodity sectors can decline during broader inflationary periods if localized supply surges or bumper agricultural harvests occur.
- Myth: Trading commodity futures always involves taking physical delivery of raw materials.
- Fact: Many retail brokerages restrict or liquidate positions approaching physical-delivery obligations, while some products are cash-settled or otherwise structured to avoid physical delivery for retail investors.
Frequently Asked Questions
What does contango mean in commodity trading?
Contango refers to a market condition where futures contract prices trade higher than current spot prices, resulting in an upward-sloping forward curve. This often occurs when physical supplies are plentiful and the market prices in ongoing financing, storage, and insurance carrying costs.
What is the difference between Brent and WTI crude oil?
West Texas Intermediate (WTI) is a light, sweet crude oil extracted in North America and physically deliverable at Cushing, Oklahoma. Brent Crude is a waterborne benchmark reflecting international production and logistics, serving as a primary reference for global crude pricing.
Why don’t physical commodities pay dividends or contractual interest?
Physical commodities are raw materials rather than operating corporate businesses or contractual loan agreements. Because a physical unit of copper or wheat generates no internal operating earnings, holding physical commodities incurs storage and handling costs rather than generating contractual income streams.
How does the US Dollar affect commodity prices?
Because international benchmark commodity contracts are priced predominantly in US Dollars, a weakening dollar generally makes raw materials less expensive for foreign buyers using other currencies, supporting global purchasing power. Conversely, a strengthening dollar can make commodities more expensive for international buyers.
What is the Commitments of Traders (COT) report?
The Commitments of Traders (COT) report is a weekly publication issued by the U.S. Commodity Futures Trading Commission (CFTC) providing a breakdown of open interest across commercial hedgers, institutional asset managers, and other market participants across U.S. futures exchanges.
Strategic Summary & Core Takeaways
- Physical Economic Foundation: Commodities represent standardized raw materials categorized into Hard (extracted or mined energy and metals) and Soft (agricultural crops and livestock).
- The Cost of Carry Framework: The relationship between spot and forward pricing is governed by financing rates, physical storage fees, and insurance costs, balanced by the convenience yield of holding physical inventory.
- Term Structure and Roll Dynamics: Investors in futures-based vehicles must account for curve geometry; persistent Contango creates roll yield drag, while Backwardation can provide a positive roll contribution.
- Macroeconomic Sensitivity: Commodity prices are influenced by the US Dollar exchange rate, real interest rate carrying costs, global industrial activity, and logistical shipping corridors.
- Multiple Investment Pathways: Market access includes direct physical holdings (bullion), commodity exchange-traded products (ETPs), resource producer equities, and exchange-traded futures and options.
Next Reading Suggestions
- What Is Gold? The Complete Guide to Real Money, Store of Value & Why It Matters
- How Stock Prices Are Determined: Market Microstructure, Supply and Demand, and Valuation
- Interest Rates and Exchange Rates: The Complete Guide to Global Currency Pricing
- Fed Rate Cuts & Global Liquidity: The Complete Guide to Interest Rates, the Fed Balance Sheet, and Asset Markets
- What Is Market Capitalization? The Complete Guide to Market Cap, Company Size, and Valuation
- Canada TSX: The Complete Guide to the S&P/TSX Composite Index, Methodology, and Market Structure
- Australia ASX 200: The Complete Guide to the S&P/ASX 200 Index, Methodology, and Market Structure
- USA S&P 500: The Complete Guide to Index Methodology, Market-Cap Weighting, and Global Market Mechanics
- Germany DAX 40: The Complete Guide to Components, Total Return Methodology, and Global Market Mechanics
Author Box & E-E-A-T Verification
Written & Researched By: CurrencyPlans Editorial Research Team
Editorial Review & Methodological Standards: This global commodity market manual is compiled using primary exchange operational rulebooks, physical delivery specifications, and official regulatory publications. Quantitative pricing frameworks—including the continuous cost of carry model, futures roll yield mechanics, warehouse warrant delivery protocols, and commercial clearing mechanisms—have been referenced from publications issued by the Commodity Futures Trading Commission (CFTC), CME Group, the London Metal Exchange (LME), and the Intercontinental Exchange (ICE).
Educational References & Market Data Sources
For official futures specifications, warehouse delivery points, and physical market data, consult primary regulatory and exchange portals directly:
- U.S. Commodity Futures Trading Commission (CFTC Commitments of Traders): CFTC
- CME Group (Agricultural, Energy & Metals Specifications): CME Group
- London Metal Exchange (Industrial Base Metals Rules): LME
- Intercontinental Exchange (Global Energy & Soft Commodities): ICE
- U.S. Energy Information Administration (Petroleum Data): EIA
- London Bullion Market Association (LBMA Precious Metals Standards): LBMA
Educational Disclaimer
This guide is prepared strictly for educational, research, and informational purposes and does not constitute personalized financial, investment, trading, or tax advice. Commodity spot markets, derivative futures contracts, and physical assets carry substantial capital risks. Past market performance and forward curve shapes do not guarantee future financial returns. Always conduct independent due diligence and consult a licensed fiduciary advisor before allocating investment capital.

