
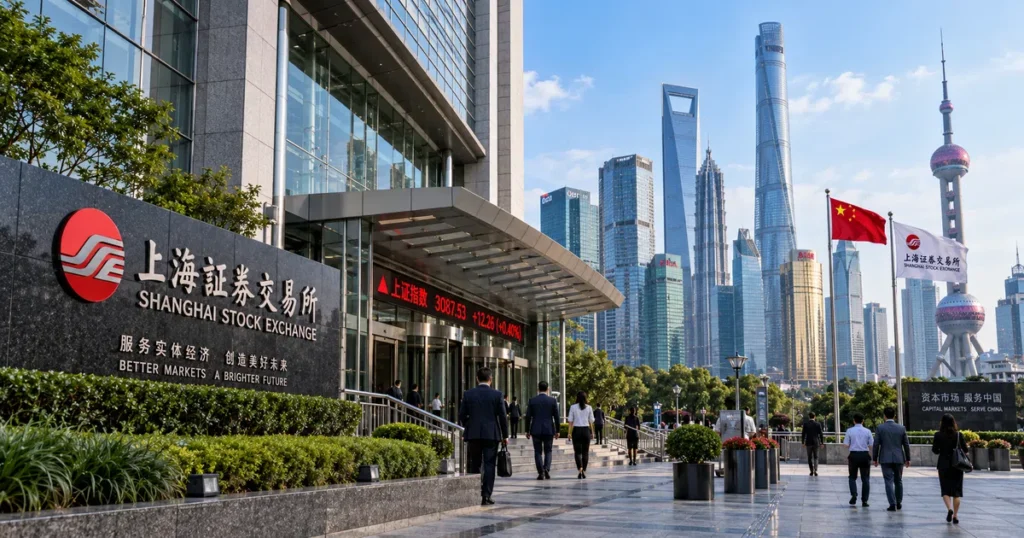
The China Shanghai CSI architecture—headlined by the CSI 300 Index—serves as the preeminent institutional equity benchmark for the Mainland Chinese economy. While the historic Shanghai Composite Index (SSE Composite) has tracked all listed securities on the Shanghai trading floor since 1991, institutional allocators and global index managers rely on the CSI 300 as the definitive, investable barometer of China’s domestic A-share equity universe.
Administered by China Securities Index Company (CSI)—a joint venture established by the Shanghai Stock Exchange (SSE) and the Shenzhen Stock Exchange (SZSE)—the index tracks the 300 largest and most liquid A-share companies listed across both exchanges. Covering a substantial share of Mainland China’s A-share market capitalization on the Mainland, the CSI 300 functions as the Chinese counterpart to major international benchmarks such as the USA S&P 500. Understanding the CSI framework requires analyzing its float-adjusted category weighting rules, the distinct regulatory features of domestic A-shares, the mechanisms of the Hong Kong Stock Connect, and the macroeconomic influence of the People’s Bank of China (PBOC), aligning with our fundamental guide on how stock prices are determined.
Executive Summary: The Dual-Exchange Architecture (SSE, SZSE & CSI)
Quick Answer: What Is the CSI 300 Index in China?
The CSI 300 Index (ticker:
000300on SSE,399300on SZSE) is a free-float market-capitalization-weighted benchmark comprising the 300 largest and most liquid A-shares listed on the Shanghai Stock Exchange and Shenzhen Stock Exchange. Managed by China Securities Index Co., it serves as the primary underlying asset for domestic index funds, international Exchange-Traded Funds (ETFs), and onshore financial derivatives.
To navigate the Chinese equity market, investors must distinguish between the operating exchanges and the index provider:
                          ┌──────────────────────────────────────────────┐
                          │         CHINA PUBLIC EQUITY STRUCTURE        │
                          └──────────────────────┬───────────────────────┘
                                                 │
         ┌───────────────────────────────────────┴───────────────────────────────────────┐
         │                                                                               │
         ▼                                                                               ▼
┌────────────────────────────────────────┐                     ┌────────────────────────────────────────┐
│ SHANGHAI STOCK EXCHANGE (SSE)          │                     │ SHENZHEN STOCK EXCHANGE (SZSE)         │
├────────────────────────────────────────┤                     ├────────────────────────────────────────┤
│ * Established 1990 (Pudong, Shanghai)  │                     │ * Established 1990 (Shenzhen)          │
│ * Traditional Main Board (SOEs, Banks, │                     │ * Main Board (Consumer, Manufacturing) │
│   Industrial Conglomerates, Energy)    │                     │ * ChiNext Board (Innovative Growth,    │
│ * STAR Market (Sci-Tech Innovation)    │                     │   High-Tech Startups, Clean Energy)    │
└───────────────────┬────────────────────┘                     └───────────────────┬────────────────────┘
                    │                                                              │
                    └──────────────────────────────┬───────────────────────────────┘
                                                   │
                                                   ▼
                    ┌─────────────────────────────────────────────────────────────┐
                    │ CHINA SECURITIES INDEX CO., LTD. (CSI)                      │
                    ├─────────────────────────────────────────────────────────────┤
                    │ * 50/50 Joint Venture between SSE and SZSE (Launched 2005)  │
                    │ * Compiles, calculates, and maintains the **CSI 300 Index** │
                    │ * Unifies top 300 liquid A-shares across both trading floors│
                    └─────────────────────────────────────────────────────────────┘
The Mainland capital market operates on three structural pillars:
- The Share Classification System: The domestic market consists primarily of A-shares (shares of Mainland-incorporated companies traded in Chinese Yuan/RMB) and historic B-shares (foreign-currency denominated shares). The CSI 300 tracks exclusively eligible A-shares.
- Dual-Exchange Selection: Rather than confining constituent selection to a single exchange, the CSI 300 aggregates large-cap leaders from both the Shanghai Main Board/STAR Market and the Shenzhen Main Board/ChiNext.
- Unified Investability Standard: The CSI 300 serves as an important benchmark for institutional index investing, with quantitative liquidity filters, eligibility screens, and semi-annual rebalancing helping maintain a liquid and representative large-cap A-share universe.
The Structural Evolution: From SSE Composite to the Joint CSI Benchmark

Quick Answer: Why Did China Introduce the CSI 300 When the Shanghai Composite Already Existed?
The Shanghai Composite Index (
000001.SS) is a total-market-capitalization index that includes eligible stocks listed exclusively on the Shanghai exchange, meaning it has historically carried significant weight in state-owned commercial banks and industrial firms while omitting high-growth private enterprises listed in Shenzhen. The CSI 300 was launched in April 2005 to create a unified, cross-exchange, float-adjusted benchmark suitable for modern indexing and derivatives.
The evolutionary roadmap of China’s modern equity markets reflects continuous market development:
- December 1990 (Exchange Openings): The Shanghai Stock Exchange and Shenzhen Stock Exchange officially begin operations, marking the return of modern financial exchanges to Mainland China following economic reforms initiated under Deng Xiaoping.
- July 1991 (SSE Composite Launch): The Shanghai Composite Index is introduced with a base value of 100 (base date: December 19, 1990), serving as the historic retail gauge of Chinese stock performance.
- 2002 (QFII Framework): China launches the Qualified Foreign Institutional Investor (QFII) system, allowing licensed international fund managers to trade domestic A-shares subject to foreign exchange quotas.
- December 31, 2004 (CSI 300 Base Date): China Securities Index Co. establishes the baseline calculation for the CSI 300 at 1,000.00 points.
- April 8, 2005 (Official CSI 300 Launch): The index commences live calculation and dissemination, creating the first joint index tracking top securities across both Shanghai and Shenzhen.
- April 2010 (Derivatives Architecture): The China Financial Futures Exchange (CFFEX) launches CSI 300 Index Futures (
IF), inaugurating onshore financial equity derivative hedging. - November 2014 & December 2016 (Stock Connect Revolution): The Shanghai-Hong Kong and Shenzhen-Hong Kong Stock Connect programs launch, allowing international institutional capital to trade eligible Mainland A-shares directly via Hong Kong brokerages.
- 2020 (QFI Regulatory Integration): China unifies the former QFII and RQFII programs into the comprehensive Qualified Foreign Investor (QFI) framework, streamlining account opening, broadening investable asset classes, and eliminating quota restrictions.
Eligibility & Inclusion Criteria: Float Ratios and Semi-Annual Reviews
Quick Answer: How Does a Company Qualify for the CSI 300?
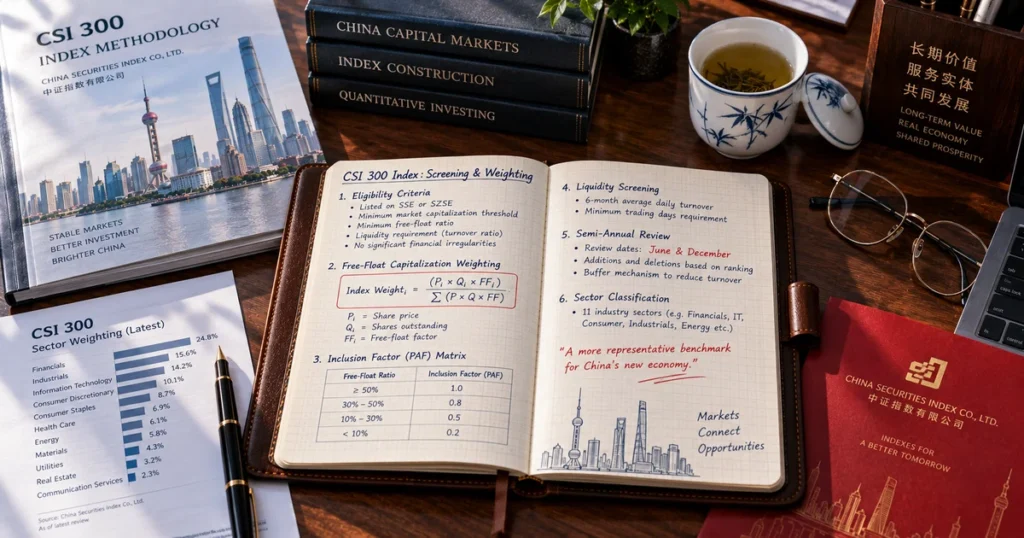
To qualify for addition to the CSI 300 selection universe, Science and Technology Innovation Board (STAR) and ChiNext securities generally must have been listed for more than one year. For other eligible securities, the standard listing-history requirement is more than three months, unless the security’s daily average total market capitalization since its initial listing ranks within the top 30 of the eligible A-share universe.
The Index Advisory Committee of China Securities Index Co. applies quantitative screening hurdles during semi-annual index reviews:
1. Listing History Requirements
- STAR Market and ChiNext Securities: Must generally maintain a listing history of more than one year to ensure sufficient seasoning and operating disclosure.
- Main Board Securities: Standard listing history requirement is more than three months.
- Fast-Track Top-30 Exemption: If an eligible newly listed security’s daily average total market capitalization since its initial public offering ranks within the top 30 of the entire eligible A-share universe, its listing-history requirement is shortened to bypass the standard seasoning period.
2. Operational & Regulatory Filters
Candidates in the index universe must demonstrate operational compliance:
- Companies must maintain acceptable operating health and be free of serious legal or regulatory violations.
- Securities must avoid extreme, abnormal price volatility that may indicate market manipulation.
- Stocks categorized under Special Treatment (
STor*ST) due to financial distress or delisting warnings are strictly excluded from the selection universe.
3. Liquidity Screening
Candidate stocks must demonstrate trading liquidity:
- CSI Methodology Filter: All eligible securities in the universe are ranked by average daily trading value over the trailing year. The bottom 50% by average daily trading value are eliminated, ensuring that only actively traded equities remain.
- Market Capitalization Selection: The remaining qualified candidate pool is ranked by daily average total market capitalization over the trailing year, with the top 300 selected as index constituents.
4. Selection Buffer Rules
To limit unnecessary portfolio churn for tracking funds, the semi-annual reconstitution applies buffer thresholds:
- Candidate Additions: Non-constituents ranked within the top 240 receive priority for addition to the index.
- Existing Constituent Protection: Existing members ranked within the top 360 receive priority to remain in the index, helping reduce unnecessary constituent turnover during periodic rebalancing.
Weighting Architecture: Free-Float Inclusion, PAF Matrix, and Divisor Formula
Quick Answer: How Is the CSI 300 Calculated?
The CSI 300 is calculated using a modified free-float market-capitalization weighting methodology. Rather than counting all shares, CSI evaluates the percentage of freely tradable shares and applies an official Inclusion Factor (Category Weighting), multiplying the adjusted share count by the stock price and dividing by an institutional Index Divisor.
$$\text{Index Level} = \frac{\sum_{i=1}^{300} (P_i \times \text{Adjusted Shares}_i)}{\text{Divisor}} \times 1000$$
Where:
- $P_i$ is the prevailing real-time trading price of constituent $i$.
- $\text{Adjusted Shares}_i$ represents total issued shares multiplied by the company’s Inclusion Factor (Weighting Factor) derived from free-float testing.
- $\text{Divisor}$ is the mathematical continuity scaling value adjusted during corporate capital changes (share repurchases, rights issues, spin-offs) to ensure non-market events do not distort the index level, matching the foundational mathematics explained in our guide on what is market capitalization.
The Category Weighting Matrix (Inclusion Factor)
CSI employs a structured step-function matrix to convert free-float percentages into practical inclusion factors:
| Free-Float Rate (Free Float / Total Shares) | Inclusion Factor Applied to Total Shares |
| Less than or equal to 15% | Exact Free-Float Percentage (Rounded up to nearest 1%) |
| 15% < Free Float $\le$ 20% | 20% |
| 20% < Free Float $\le$ 30% | 30% |
| 30% < Free Float $\le$ 40% | 40% |
| 40% < Free Float $\le$ 50% | 50% |
| 50% < Free Float $\le$ 60% | 60% |
| 60% < Free Float $\le$ 70% | 70% |
| 70% < Free Float $\le$ 80% | 80% |
| Greater than 80% | 100% (Full Inclusion) |
This systematic rounding matrix reduces tracking volatility caused by minor daily fluctuations in strategic state-owned shareholdings or corporate insider stakes.
Rebalancing Calendar: Semi-Annual Reconstitution
Unlike North American benchmarks that rebalance quarterly, the CSI 300 undergoes scheduled reconstitution semi-annually:
- Review Months: May and November.
- Effective Date: The reconstitution takes effect after the close of trading on the second Friday of June and December.
- Turnover Cap: To protect institutional tracking efficiency, constituent adjustments during a single regular review are generally capped at 10% (a maximum of 30 stocks).
11 CSI Industry Sector Composition: Technology, Manufacturing, and Financials

Quick Answer: What Sectors Dominate the CSI 300?
The CSI 300 features large allocations to Information Technology, Financials, Industrials, and Consumer Staples. Dynamic market growth and technology upgrades have expanded the weight of advanced electronics and manufacturing alongside traditional commercial banking and beverage leaders.
Constituents are categorized under CSI industry standards into 11 main operating segments:
Representative CSI 300 Sector Breakdown
| CSI Sector | Representative Share of Index* | Primary Economic Role | Representative Blue-Chip Constituents |
| Information Technology | ~24% – 28% | Semiconductor fabrication, artificial intelligence hardware, optical modules, software | Contemporary optical module leaders, SMIC, Foxconn Industrial Internet, NAURA Technology |
| Financials | ~17% – 20% | Commercial banking institutions, national insurers, brokerage houses | Industrial and Commercial Bank of China (ICBC), China Construction Bank (CCB), Ping An Insurance, China Merchants Bank |
| Industrials | ~12% – 15% | High-speed rail equipment, electrical infrastructure, industrial machinery, logistics | Contemporary Amperex Technology (CATL), Midea Group, China Railway, NARI Technology |
| Materials | ~8% – 10% | Lithium extraction, copper refining, solar polysilicon, chemical processing | Zijin Mining, Wanhua Chemical, Ganfeng Lithium, Northern Rare Earth |
| Consumer Staples | ~5% – 8% | Premium baijiu distillers, food processing, agricultural products | Kweichow Moutai (600519), Wuliangye Yibin (000858), Foshan Haitian Flavouring |
| Consumer Discretionary | ~4% – 6% | Electric vehicles, home appliance brands, automotive components | BYD Company (002594), Great Wall Motor, SAIC Motor |
| Health Care | ~3% – 5% | Innovative biopharma, medical devices, research outsourcing | Jiangsu Hengrui Pharmaceuticals, Mindray Medical, WuXi AppTec |
| Energy | ~2% – 4% | Integrated oil & gas conglomerates, coal mining, pipeline transport | PetroChina, Sinopec, China Shenhua Energy |
| Utilities | ~2% – 3% | Hydroelectric power generation, nuclear energy facilities, utility grids | China Yangtze Power, China National Nuclear Power |
| Communication Services | ~1% – 3% | Telecommunications networks, digital media infrastructure | China Mobile, China Telecom, China Unicom |
| Real Estate | < 1% | State-backed property developers, commercial property operators | China Vanke, Poly Developments and Holdings |
*Note: Approximate snapshot based on September 2026 ETF portfolio distributions; sector weights adjust dynamically based on market price movements and semi-annual reconstitutions.
The Prominence of Leading Blue Chips
A hallmark of the CSI 300 is the significant influence of flagship corporations:
- Consumer Leadership: Kweichow Moutai (600519), the premium baijiu distiller, remains one of the most prominent individual constituents in the benchmark, serving as a corporate barometer for domestic Chinese consumer demand.
- Advanced Manufacturing & Green Transition: Industrial giants such as CATL (Contemporary Amperex Technology) and BYD, alongside high-growth optical hardware and semiconductor leaders, represent a substantial component of index weight, reflecting China’s broader capital reallocation toward high-end manufacturing.
Macroeconomic Drivers: PBOC Liquidity, Yuan Valuation, and State Allocation
Quick Answer: What Macro Factors Move the China Shanghai CSI?
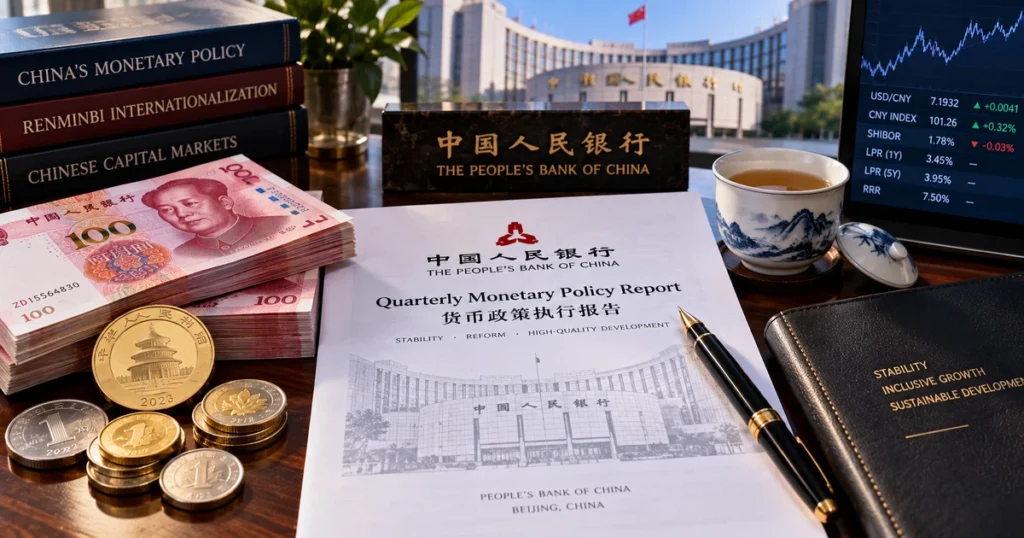
The CSI 300 is driven by three macroeconomic mechanisms: People’s Bank of China (PBOC) monetary policy, the exchange rate of the Chinese Yuan (specifically USD/CNY), and domestic state capital allocations, including market stabilization operations conducted by state-backed entities.
                      ┌─────────────────────────────────────────┐
                      │    MACRO TRANSMISSION CHANNELS TO CSI   │
                      └────────────────────┬────────────────────┘
                                           │
         ┌─────────────────────────────────┴─────────────────────────────────┐
         │                                                                   │
         ▼                                                                   ▼
┌──────────────────────────────────┐               ┌──────────────────────────────────┐
│ PBOC MONETARY POLICY & CREDIT    │               │ EXTERNAL CHANNELS & CURRENCY     │
├──────────────────────────────────┤               ├──────────────────────────────────┤
│ * Reserve Requirement Ratio:     │               │ * USD/CNY Onshore Trading Band:  │
│   Influences banking reserves    │               │   Onshore Yuan moves within ±2%  │
│   and institutional liquidity    │               │   daily band around PBOC fix     │
│ * Medium-Term Lending Facility:  │               │ * Cross-Border Capital Flows:    │
│   Important policy funding tool  │               │   RMB valuation influences       │
│   guiding interbank credit       │               │   foreign fund allocations       │
│ * Loan Prime Rate (LPR):         │               │ * Global Supply Chains:          │
│   Benchmark lending reference    │               │   Drives manufacturing revenues  │
│   for commercial enterprises     │               │   and industrial export margins  │
└──────────────────────────────────┘               └──────────────────────────────────┘
1. People’s Bank of China (PBOC) Monetary Policy Transmission
The PBOC utilizes a diversified structural monetary toolkit:
- Reserve Requirement Ratio (RRR): Adjusting the percentage of deposits commercial banks must maintain at the central bank influences aggregate liquidity conditions across the banking system, affecting borrowing costs for listed enterprises.
- Medium-Term Lending Facility (MLF): Serves as an important policy and liquidity management tool that guides interbank borrowing costs.
- Loan Prime Rate (LPR): Serves as the primary reference lending-rate mechanism used by commercial banks for corporate loans and residential mortgages, dynamics examined in our treatise on interest rates and exchange rates.
2. The Renminbi Exchange Rate Framework (USD/CNY)
The onshore Chinese Yuan (CNY) trades under a regulated framework against the US Dollar, where the daily exchange rate is permitted to fluctuate within a $\pm 2\%$ trading band around the PBOC’s official central parity fixing rate:
- A stable or appreciating Yuan enhances foreign investor returns on A-shares, encouraging cross-border allocations through Northbound Stock Connect.
- Significant currency volatility or depreciation can lead offshore asset managers to trim domestic equity exposures to mitigate foreign exchange translation risk.
3. Sovereign Institutional Support (“The National Team”)
The Chinese equity market features structural participation from state-affiliated investment entities—frequently referred to by market participants as the “National Team”—including Central Huijin Investment, China Securities Finance Corporation (CSFC), and the National Social Security Fund. During periods of heightened market volatility, these entities have historically allocated capital to broad-market index ETFs, providing an institutional liquidity backstop.
Market Access Channels: Stock Connect and the Qualified Foreign Investor (QFI) Regime
Quick Answer: How Do International Investors Buy Chinese A-Shares?
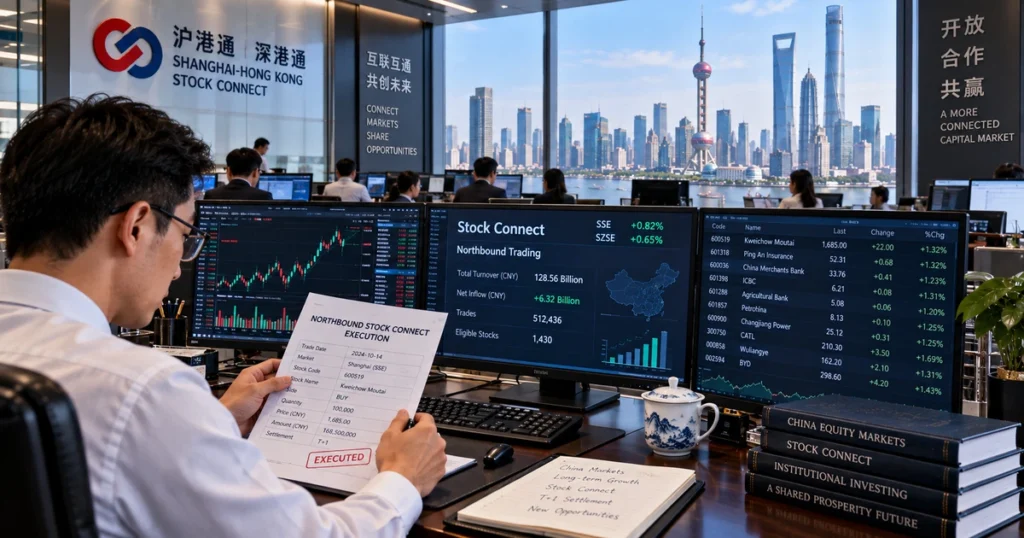
The primary gateway for foreign investors is Stock Connect (Northbound Trading), which allows global institutions and retail traders to purchase eligible Shanghai and Shenzhen A-shares through accounts held with Hong Kong brokerages. International institutional allocators also utilize the integrated Qualified Foreign Investor (QFI) framework for direct onshore trading.
+---------------------------------------------------------------------------------------------------+
|                           MAINLAND CHINA CAPITAL ACCESS INFRASTRUCTURE                            |
+---------------------+-----------------------------+-----------------------+-----------------------+
| ACCESS CONDUIT      | OPERATIONAL MECHANISM       | TRADING & SETTLEMENT  | TARGET INVESTORS      |
+---------------------+-----------------------------+-----------------------+-----------------------+
| **Stock Connect     | Orders route through Hong   | Traded and settled in | Global retail and     |
| (Northbound)**      | Kong Exchanges (HKEX) into  | **Renminbi (RMB)**    | institutional funds;  |
|                     | SSE & SZSE matching engines | via cross-border link | major foreign channel |
+---------------------+-----------------------------+-----------------------+-----------------------+
| **Qualified Foreign | Direct onshore brokerage    | Onshore Renminbi      | Global sovereign funds|
| Investor (QFI)**    | accounts under CSRC license | (CNY) via foreign     | pension plans, and    |
|                     | and domestic custodian bank | currency conversion   | quantitative desks    |
+---------------------+-----------------------------+-----------------------+-----------------------+
| **Offshore Global   | Shares of ETFs listed on    | Traded in foreign     | International retail  |
| ETFs (e.g., ASHR)** | NYSE Arca, London, or Tokyo | currencies (USD, EUR, | investors seeking pure|
|                     | holding physical A-shares   | GBP) on home exchanges| passive A-share beta  |
+---------------------+-----------------------------+-----------------------+-----------------------+
Stock Connect Infrastructure
Stock Connect Northbound represents a vital bridge for foreign capital in eligible Mainland A-shares. The system connects the Hong Kong Securities Clearing Company (HKSCC) with China Securities Depository and Clearing Corporation (ChinaClear). Importantly, Northbound trading and settlement are conducted directly in Renminbi (RMB), providing seamless clearing without requiring direct onshore accounts.
Trading Mechanics: Daily Sessions, Midday Break, and Modernized 2026 Rules
Quick Answer: When Does the Shanghai Stock Exchange Trade and What Are the 2026 Rules?
The Shanghai and Shenzhen exchanges trade Monday through Friday across a morning session (09:30–11:30 CST) and an afternoon session (13:00–15:00 CST), separated by a 90-minute midday break. The market enforces a strict T+1 rule (shares bought cannot be sold on the same day). Following the July 6, 2026 trading overhaul, after-hours fixed-price trading (15:05–15:30) was expanded to all A-shares and ETFs, and Main Board ST stock price limits were widened to $\pm 10\%$.
Daily Trading Schedule (China Standard Time – CST / UTC+8):
- 09:15 – 09:25 CST (Opening Call Auction):
- 09:15 – 09:20: Orders can be entered and cancelled.
- 09:20 – 09:25: Orders can be entered, but cannot be cancelled. The system computes the indicative opening match price.
- 09:25: The official opening price is executed.
- 09:30 – 11:30 CST (Morning Continuous Auction Session): Continuous electronic order matching executes based on Price/Time priority.
- 11:30 – 13:00 CST (Midday Trading Break): Continuous matching pauses for 90 minutes.
- 13:00 – 14:57 CST (Afternoon Continuous Auction Session): Continuous electronic trading resumes across all Main Board, STAR, and ChiNext equities.
- 14:57 – 15:00 CST (Closing Call Auction): Orders accumulate for three minutes to determine the official daily closing price, preventing late-session volatility.
- 15:05 – 15:30 CST (After-Hours Fixed-Price Trading): Since July 6, 2026, this session has been expanded across the Shanghai and Shenzhen exchanges to cover all A-shares and ETFs, with eligible orders matched at the official closing price on a time-priority basis.
Core Microstructure Rules:
- The T+1 Trading Restriction: Unlike Western markets where day-trading is standard (T+0), Chinese A-shares operate under a T+1 trading restriction. Shares purchased on day T cannot be sold until day T+1, a regulatory measure intended to reduce intraday speculative volatility.
- Daily Price Fluctuation Limits (Updated 2026):
- Main Board Regular Equities (SSE & SZSE): Bounded within a $\pm 10\%$ daily limit from the prior day’s closing price.
- Main Board Special Treatment Stocks (
STand*ST): Following the July 6, 2026 regulatory overhaul, daily price limits for Main Board ST stocks were expanded from $\pm 5\%$ to $\pm 10\%$, standardizing price bands across the Main Board to improve pricing efficiency. - STAR Market (SSE) & ChiNext (SZSE): Maintain expanded daily price fluctuation limits of $\pm 20\%$.
Benchmark Variations: CSI 300 vs. SSE Composite vs. SSE 50 vs. CSI 500
Quick Answer: What Is the Difference Between the CSI 300, Shanghai Composite, and CSI 500?
The CSI 300 tracks 300 large-cap blue-chip A-shares across both Shanghai and Shenzhen. The Shanghai Composite (
000001.SS) tracks all eligible stocks listed on the Shanghai Stock Exchange. The SSE 50 tracks the 50 largest companies in Shanghai, while the CSI 500 tracks 500 mid-cap and small-cap enterprises ranked 301 through 800 nationwide.
| Benchmark Dimension | CSI 300 Index (000300) | Shanghai Composite (000001.SS) | SSE 50 Index (000016) | CSI 500 Index (000905) |
| Exchange Coverage | Shanghai & Shenzhen | Shanghai Stock Exchange only | Shanghai Stock Exchange only | Shanghai & Shenzhen |
| Constituent Count | Exactly 300 stocks | All eligible listed stocks | 50 Mega-Cap blue chips | 500 Mid-Cap enterprises |
| Market Segment | Large-Cap Core Leaders | Entire Exchange Universe | Mega-Cap Enterprises | Mid-Cap / Growth Equities |
| Weighting Method | Free-Float Market Cap | Total Market Capitalization | Free-Float Market Cap | Free-Float Market Cap |
| Underlying Equities | A-Shares | A-Shares & B-Shares | A-Shares | A-Shares |
| Primary Derivatives | CFFEX IF Futures | None | CFFEX IH Futures | CFFEX IC Futures |
| Rebalancing Cycle | Semi-Annual (June/Dec) | Continuous adjustments | Semi-Annual (June/Dec) | Semi-Annual (June/Dec) |
How to Gain Exposure to the China Shanghai CSI
Quick Answer: How Do Investors Invest in the CSI 300 Index?
Domestic investors buy onshore index funds and ETFs listed on the SSE and SZSE. International investors gain exposure via Stock Connect, U.S.-listed physical A-share ETFs (such as ASHR), or onshore CSI 300 Index Futures traded on the CFFEX.
+---------------------------------------------------------------------------------------------------+
|                        CHINA CSI 300 INVESTMENT & TRADING ACCESS ROUTES                           |
+---------------------+-----------------------------+-----------------------+-----------------------+
| ACCESS VEHICLE      | TICKER EXAMPLES             | TRADING VENUE         | TARGET INVESTOR       |
+---------------------+-----------------------------+-----------------------+-----------------------+
| **Onshore Core      | Huatai-PineBridge CSI 300   | Shanghai Stock Exch.  | Domestic Chinese      |
| CSI 300 ETF**       | ETF (`510300.SS`)           | (Traded in CNY)       | institutions & retail |
|                     | ChinaAMC CSI 300 (`510330`)|                       | allocators            |
+---------------------+-----------------------------+-----------------------+-----------------------+
| **U.S.-Listed       | Xtrackers Harvest CSI 300   | NYSE Arca             | International retail  |
| Physical A-Share**  | China A-Shares ETF (`ASHR`) | (Traded in USD)       | & institutional funds |
+---------------------+-----------------------------+-----------------------+-----------------------+
| **Hong Kong-Listed  | CSOP CSI 300 ETF            | Hong Kong Exchanges   | Global allocators     |
| Cross-Border ETF**  | (`3188.HK` / `83188.HK`)    | (Traded in HKD / RMB) | utilizing offshore CNH|
+---------------------+-----------------------------+-----------------------+-----------------------+
| **Onshore Index     | CSI 300 Index Futures       | China Financial       | Institutional hedgers,|
| Futures**           | (Ticker symbol `IF`)        | Futures Exchange      | onshore quant funds   |
+---------------------+-----------------------------+-----------------------+-----------------------+
Note: While offshore contracts such as the FTSE China A50 Futures (XIN9 on SGX) provide broad large-cap China exposure, direct derivatives tracking of the CSI 300 is centered on the CFFEX IF contract.
Comparative Analysis: CSI 300 vs. Global Equity Benchmarks
Quick Answer: How Does China’s CSI 300 Compare to the S&P 500, DAX 40, and ASX 200?
The CSI 300 provides exposure to China’s large domestic market, balancing state-owned enterprises with high-tech manufacturing, while trading under unique microstructure rules such as T+1 restrictions and daily price limits.
| Dimension / Metric | China CSI 300 (000300) | USA S&P 500 (SPX) | Germany DAX 40 (DAX) | Australia ASX 200 (XJO) |
| Constituent Count | Exactly 300 | 500 Large-Cap US firms | 40 Major German firms | Exactly 200 companies |
| Weighting Method | Category-Float MCap | Float-Adjusted MCap | Free-Float MCap | Float-Adjusted MCap |
| Primary Currency | Chinese Yuan (CNY) | US Dollar (USD) | Euro (EUR) | Australian Dollar (AUD) |
| Headline Return | Price Return | Price Return | Total Return (Gross) | Price Return |
| Top Sector Bias | Technology & Financials | Information Technology | Industrials & Autos | Financials & Materials |
| Trading Restrictions | T+1 Rule, $\pm 10\%$ Limits | T+0 Allowed, Circuit Breakers | T+0 Allowed, Volatility Halts | T+0 Allowed, Volatility Halts |
| Midday Break? | Yes (11:30 – 13:00 CST) | None (Continuous) | None (Continuous) | None (Continuous) |
| Foreign Access | Stock Connect & QFI | Fully Open | Fully Open | Fully Open |
Common Myths vs. Empirical Facts
- Myth: The Shanghai Composite and the CSI 300 are the same index.
- Fact: The Shanghai Composite (
000001.SS) tracks all eligible stocks listed exclusively on the Shanghai Stock Exchange using total market cap. The CSI 300 tracks 300 liquid stocks across both Shanghai and Shenzhen using float-adjusted weighting.
- Fact: The Shanghai Composite (
- Myth: Investors can day-trade Chinese A-shares like U.S. stocks.
- Fact: Under Chinese securities rules, A-shares operate under the strict T+1 trading restriction. Shares purchased during today’s trading session cannot be sold until the following trading day.
- Myth: Foreigners cannot directly buy Mainland Chinese stocks.
- Fact: Through the Stock Connect infrastructure, international investors holding accounts with authorized Hong Kong and global brokerages can trade eligible Mainland A-shares directly in Renminbi.
- Myth: Main Board ST stocks are limited to 5% daily price moves.
- Fact: Effective July 6, 2026, the daily price limit for Main Board Special Treatment (
STand*ST) stocks was expanded from $\pm 5\%$ to $\pm 10\%$, standardizing price bands across Main Board equities.
- Fact: Effective July 6, 2026, the daily price limit for Main Board Special Treatment (
Frequently Asked Questions
What does CSI stand for in Chinese finance?
CSI stands for China Securities Index Company, Ltd. (中证指数有限公司), the official index calculation agency co-founded by the Shanghai Stock Exchange and Shenzhen Stock Exchange to manage domestic financial benchmarks.
Can foreign retail investors buy the CSI 300?
Yes. International retail investors access the CSI 300 either through international Exchange-Traded Funds such as ASHR (NYSE Arca) or by purchasing eligible A-share constituents directly through brokerages connected to the Northbound Stock Connect system.
How often is the CSI 300 Index rebalanced?
The CSI 300 undergoes scheduled semi-annual rebalancings in June and December (effective after the close of trading on the second Friday of the month), with constituent turnover generally capped at 10% per review.
What is the difference between China A-shares and H-shares?
A-shares are incorporated in Mainland China, denominated in Chinese Yuan (RMB), and listed in Shanghai or Shenzhen. H-shares are shares of Mainland Chinese companies listed on the Hong Kong Stock Exchange, denominated in Hong Kong Dollars (HKD), and governed by Hong Kong regulatory law.
What are the trading hours for the Shanghai Stock Exchange?
The Shanghai Stock Exchange operates a morning session from 09:30 to 11:30 CST and an afternoon session from 13:00 to 15:00 CST, followed by an after-hours fixed-price session from 15:05 to 15:30 CST.
Strategic Summary & Core Takeaways
- China’s Institutional Anchor: The CSI 300 is the primary investable benchmark for Mainland Chinese equities, tracking 300 large-cap, liquid A-shares across both the Shanghai and Shenzhen exchanges.
- Float-Adjusted Methodology: Managed by China Securities Index Co., the benchmark applies a category-based free-float Inclusion Factor matrix, semi-annual reconstitutions (June/December), and a 10% maximum review turnover cap.
- Evolving Economic Footprint: Combining technology and hardware innovators with industrial leaders, state-owned commercial banks, and consumer giants, the index reflects the ongoing modernization of China’s domestic capital market.
- Distinct Trading Microstructure: The market operates under a strict T+1 trade restriction, a mandated 90-minute midday trading intermission, and updated July 6, 2026 rules expanding after-hours fixed-price trading to all A-shares/ETFs and widening Main Board ST limits to $\pm 10\%$.
- Cross-Border Capital Pipeline: International capital participates in the CSI 300 primarily through Northbound Stock Connect (traded and settled in RMB) and the integrated QFI regime.
Next Reading Suggestions
- USA S&P 500: The Complete Guide to Index Methodology, Market-Cap Weighting, and Global Market Mechanics
- Australia ASX 200: The Complete Guide to the S&P/ASX 200 Index, Methodology, and Market Structure
- Canada TSX: The Complete Guide to the S&P/TSX Composite Index, Methodology, and Market Structure
- Germany DAX 40: The Complete Guide to Components, Total Return Methodology, and Global Market Mechanics
- Dubai Financial Market (DFM): The Complete Guide to the DFMGI Index, Methodology, and Market Structure
- How Stock Prices Are Determined: Market Microstructure, Supply and Demand, and Valuation
- What Is Market Capitalization? The Complete Guide to Market Cap, Company Size, and Valuation
- Interest Rates and Exchange Rates: The Complete Guide to Global Currency Pricing
- Fed Rate Cuts & Global Liquidity: The Complete Guide to Interest Rates, the Fed Balance Sheet, and Asset Markets
- What Is Gold? The Complete Guide to Real Money, Store of Value & Why It Matters
Author Box & E-E-A-T Verification
Written & Researched By: CurrencyPlans Editorial Research Team
Editorial Review & Methodological Standards: This Mainland Chinese equity market manual is developed from primary exchange operating rules, quantitative index methodology documentation, and regulatory disclosures. Technical criteria—including China Securities Index Co. guidelines, Inclusion Factor (PAF) weighting matrices, semi-annual rebalancing schedules, the July 6, 2026 trading mechanism revisions, and Stock Connect clearing protocols—have been verified against official publications from the Shanghai Stock Exchange (SSE), Shenzhen Stock Exchange (SZSE), China Securities Regulatory Commission (CSRC), and the People’s Bank of China (PBOC).
Educational References & Market Data Sources
For official index rulebooks, constituent announcements, and trading schedules, consult primary regulatory and exchange portals directly:
- China Securities Index Co., Ltd. (CSI Official Portal): China Securities Index
- Shanghai Stock Exchange (SSE Official Portal): Shanghai Stock Exchange
- Shenzhen Stock Exchange (SZSE Official Portal): Shenzhen Stock Exchange
- Hong Kong Exchanges and Clearing (Stock Connect Portal): HKEX Stock Connect
- People’s Bank of China (PBOC Monetary Policy Statements): PBOC
- China Securities Regulatory Commission (CSRC Regulatory Oversight): CSRC
Educational Disclaimer
This guide is prepared strictly for educational, research, and informational purposes and does not constitute personalized financial, investment, trading, or tax advice. Equities, regional emerging market indices, and cross-border currency instruments carry inherent market risks. Historical returns of the CSI 300 Index do not guarantee future investment performance. Always conduct independent research and consult a licensed fiduciary financial advisor before allocating investment capital.

