

| Parameter | Market & Telemetry Overview |
| Asset Pair | BTCUSDT (Binance Perpetual / Spot Data Feed) |
| Current Market Price | $84,189.99 |
| 24-Hour Trading Range | $82,900.00 – $84,563.99 |
| Snapshot Timestamp | September 30, 2026 at 12:30 UTC |
| Execution Timeframe | 15-Minute (15M Intraday) |
| Directional Bias | Strong Bullish — Model Signal |
| Confluence Score | 75 / 100 |
| Momentum RSI-14 | 89.07 (Extended Zone) |
| Model Structure | Balanced (Proprietary SMC Classification) |
| Relative Volume (RVOL) | 1.22x Session Average |
Bitcoin is trading near the upper end of its daily range at $84,189.99. While the 15-minute trend remains positive, technical momentum has reached an unusually high level: the RSI-14 sits at 89.07.
In practical terms, Bitcoin is still moving higher, but the short-term rally is becoming stretched. When price climbs this rapidly toward major overhead price levels like $84,869 (R1) and $85,548 (R2), traders face a changing environment. Short-term momentum buyers are still active, but the risk of a fast pullback toward intraday averages increases as price moves further above the session average.
Below is an objective look at what the 15-minute indicators show, how moving averages and volume-weighted levels line up, and how traders map out the chart without relying on guesswork.
Understanding the Technical Setup: Trend Momentum vs. Extension
The 15-minute chart presents a clear contrast between a solid short-term upward trend and momentum that has moved very far, very fast.
       [R2 Resistance: $85,548.65]  ── High-Expansion Target / Secondary Overhead Level
       [R1 Resistance: $84,869.32]  ── Immediate Resistance Area
       [24H High:     $84,563.99]  ── Session High
  ►►   [CURRENT PRICE: $84,189.99]  ── High Momentum Area (RSI-14: 89.07)
       [Central Pivot: $83,884.66]  ── Session Baseline
       [EMA 20 Trend:  $83,720.69]  ── First Dynamic Support Area
       [EMA 50 Macro:  $83,571.89]  ── Intermediate 15-Minute Average
       [VWAP Anchor:   $83,523.23]  ── Volume-Weighted Average Price
       [S1 Support:    $83,205.33]  ── Key Structural Floor
       [S2 Support:    $82,220.67]  ── Lower Support Area
1. Dynamic Moving Averages (EMA 20 & EMA 50)
On this 15-minute timeframe, moving averages reflect steady upward progress:
- Current Price ($84,189.99) is holding above the EMA 20 ($83,720.69).
- The EMA 20 is positioned comfortably above the EMA 50 ($83,571.89).
This alignment shows that short-term price momentum remains above the longer-term 15-minute trend. Over the morning session, minor pullbacks toward the 20-period exponential moving average have been met with steady buying interest.
2. The VWAP Anchor Gap
The session Volume-Weighted Average Price (VWAP) is positioned at $83,523.23.
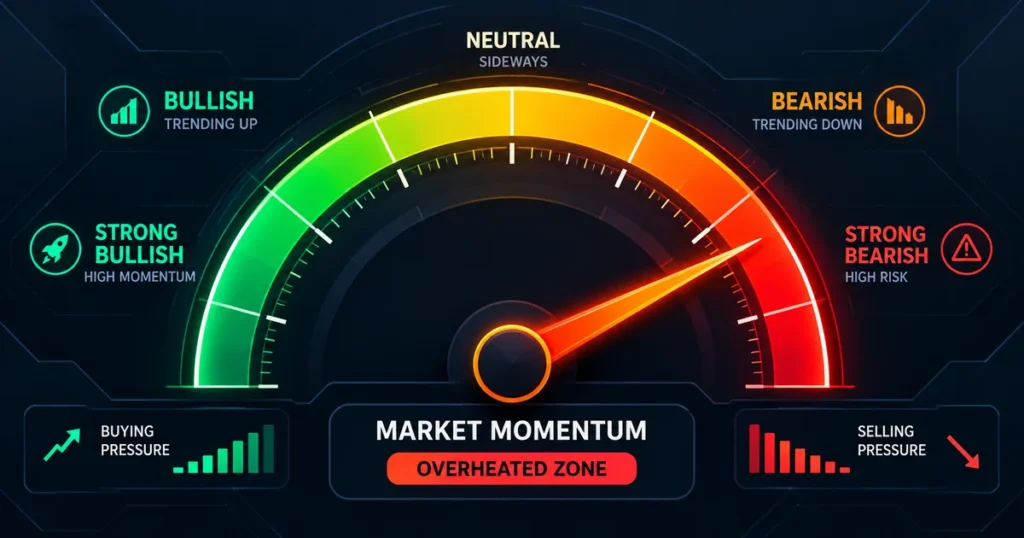
Current price is trading at a premium of +$666.76 (+0.80%) above VWAP. VWAP is often used as a reference for the average traded price during a session. When price moves far above VWAP, traders watch for either continued momentum or a move back toward the average. While strong trends can remain disconnected from VWAP for sustained stretches, buying at a +0.80% premium means paying above the session’s volume-weighted average price.
Decoding the 89.07 RSI Reading
The standout figure in this snapshot is the RSI-14 reading of 89.07.
An RSI-14 reading of 89.07 shows that recent upward price movement has been much stronger than recent downward movement. On a 15-minute chart, this is an unusually high reading and can signal that price has moved very quickly.
A very high RSI can be followed by several outcomes, including a sharp pullback, sideways consolidation, or continued momentum:
- A Fast Mean-Reversion Pullback: If aggressive buying pauses, price can quickly dip back toward the Central Pivot ($83,884.66), the EMA 20 ($83,720.69), or the session VWAP ($83,523.23) before finding its footing again.
- Horizontal Price Consolidation: Price can hold its ground in a narrow range—such as between $84,000 and $84,400. In this scenario, the RSI cools down toward neutral levels (around 50 to 60) over time rather than through a large drop in price.
The terminal’s proprietary model categorizes the current structure as Balanced, alongside a 1.22x Relative Volume (RVOL) reading. This indicates that while volume has expanded moderately above the session average, trading activity around the 24-hour high ($84,563.99) reflects active two-way participation between buyers and sellers.

Key Pivot Levels and Support-Resistance Map
To interpret the chart cleanly, price can be mapped into distinct reference zones:
Overhead Resistance Levels
- Immediate Resistance (R1 — $84,869.32): Positioned just above the 24-hour high of $84,563.99, this area represents the first technical ceiling where previous rallies have stalled.
- Secondary Expansion Resistance (R2 — $85,548.65): The area between $85,000 and $85,550 represents the next upside level on the daily calculation sheet.
Central Inflection Level
- Central Pivot ($83,884.66): This level acts as the baseline for intraday trend control. As long as 15-minute candle bodies close above $83,884, the short-term trend remains stronger. A decisive break below this pivot often signals a shift toward consolidation.
Support Framework
- Dynamic Support Band ($83,720.69 – $83,523.23): This zone is an important area to watch because the EMA 20, EMA 50, and session VWAP are clustered close together.
- First Structural Support (S1 — $83,205.33): A key support level on the 15-minute chart. A close below S1 would weaken the immediate upward trend and shift focus to lower levels.
- Lower Support ($82,220.67): A deeper support area located below the 24-hour low of $82,900.00, marking the lower boundary of the broader daily structure.

Possible Price Scenarios to Monitor
Based on the quantitative snapshot captured at 12:30 UTC on September 30, 2026, here are three possible market scenarios:
| Scenario | Confirmation Trigger | Area to Watch | Structural Level to Watch | What the Scenario Means |
| A. Value Pullback Scenario | A test and bullish price reaction around the $83,720 – $83,523 band | $84,869 (R1) → $85,548 (R2) | 15M candle close below $83,205 (S1) | Allows the high 89.07 RSI to reset toward neutral while testing support near the dynamic moving averages. |
| B. Breakout Continuation Scenario | A decisive 15M candle close above $84,870 (R1) with sustained volume | $85,548 (R2) | 15M candle close back below $84,400 | Shows that buying pressure has strengthened around the daily high, which could support a move toward the secondary resistance area. |
| C. Mean-Reversion Scenario | A clear rejection pattern around $84,560 – $84,870 accompanied by selling volume | $83,884 (Pivot) → $83,523 (VWAP) | 15M candle close above $85,000 | Reflects a temporary exhaustion of momentum as price pulls back to retest the session’s volume-weighted average price. |
Practical Considerations for Market Observers
- Mind the Stretch Above Average: At $84,189, price is trading near the top of the current range. The distance to immediate resistance (R1) is roughly +$679, while the distance back to VWAP is -$666. Managing risk becomes challenging when price sits midway between resistance and dynamic support.
- Watch the Central Pivot: The $83,884.66 level provides a quick reference for market strength. If price dips and immediately recovers above this pivot, it indicates that buyers are still defending shallow pullbacks.
- Be Prepared for Sudden Swings: In fast-moving cryptocurrency markets, high momentum can shift abruptly. Sudden pullbacks can produce wide price swings within minutes, making position sizing and risk management essential.
Frequently Asked Questions (FAQ)
What does an RSI-14 of 89.07 indicate for BTCUSDT?
An RSI-14 reading of 89.07 shows that recent upward price movement has been much stronger than recent downward movement. On a 15-minute chart, this is an unusually high reading and can signal that price has moved very quickly, raising the possibility of a pause or pullback.
Why is the VWAP level at $83,523.23 important?
VWAP is the volume-weighted average of the prices traded during the session. Because the current price is 0.80% above VWAP, traders can use it as a reference when watching for continued momentum or a possible pullback toward the session average.
Which price level would strengthen the bullish breakout setup?
A sustained 15-minute candle close above R1 ($84,869.32) with expanding volume would show stronger buying pressure and strengthen the setup for a possible test of R2 at $85,548.65.
Which level would weaken the current 15-minute bullish structure?
A decisive 15-minute candle close below the S1 support level at $83,205.33 would weaken the current short-term trend, pointing toward a possible retest of lower demand levels near $82,220.67 (S2).
Next Reading Suggestions
- How Stock Prices Are Determined: Market Microstructure, Supply and Demand, and Valuation
- What Is Market Capitalization? The Complete Guide to Market Cap, Company Size, and Valuation
- Hard Commodities: The Complete Guide to Extracted Resources, Energy Markets, and Industrial Metals
- Interest Rates and Exchange Rates: The Complete Guide to Global Currency Pricing
- Commodity Prices: How They Are Determined, Key Drivers, and Futures Pricing
Author Box & E-E-A-T Verification
Written & Researched By: CurrencyPlans Quantitative Research Team
Editorial Review & Methodology: This market analysis evaluates Binance perpetual and spot market data captured at 12:30 UTC on September 30, 2026. Technical indicators, including exponential moving averages, volume-weighted average price (VWAP), and pivot point calculations, are generated through our proprietary charting framework. Market structure and volume indicators represent quantitative model outputs derived from public exchange feeds.
Educational References & Data Sources
- Binance Market Data Feeds (BTCUSDT Trading Data): https://www.binance.com/en/trade/BTC_USDT
- TradingView Knowledge Base (Relative Strength Index & VWAP Indicator Documentation): https://www.tradingview.com/support/solutions/43000502333-relative-strength-index-rsi/
- Investopedia (Technical Analysis & Moving Average Convergence): https://www.investopedia.com/terms/t/technicalanalysis.asp
- CoinMarketCap Bitcoin Reference Quotes: https://coinmarketcap.com/currencies/bitcoin/
Educational Disclaimer
This technical analysis report is published strictly for educational, research, and informational purposes. It does not constitute personal financial, investment, legal, or trading advice. Digital asset markets carry substantial capital risk, including the possible loss of principal. Past technical readings do not guarantee future price movement. Consider speaking with a qualified financial professional before making trading or investment decisions.

