

Introduction
The Canada TSX (Toronto Stock Exchange), operated by TMX Group, serves as the principal senior equities marketplace in Canada and one of the largest capital centers in North America. Tracing its operational roots back to 1861, the exchange provides the primary capital-raising platform for Canadian enterprises, mining companies, commercial banking institutions, and energy pipeline operators.
The S&P/TSX Composite Index is the headline benchmark for the Canadian equity market. It covers approximately 95% of the Canadian equities market, making it the broadest major benchmark in the S&P/TSX family. Managed under S&P Dow Jones Indices methodology, the index uses float-adjusted market capitalization weighting with defined liquidity, size, and price eligibility rules. For portfolio managers, quantitative allocators, and international investors, mastering the TSX framework requires understanding its resource-heavy sector composition, dual-listing dynamics with New York exchanges, and sensitivity to global commodity cycles, complementing broad equity frameworks such as our guide on how stock prices are determined.
Executive Summary: Structure of the Canadian Equity Market
Quick Answer: What Is the Canada TSX and the S&P/TSX Composite?
The Canada TSX (Toronto Stock Exchange) is Canada’s primary senior stock exchange. Its leading headline benchmark is the S&P/TSX Composite Index, a float-adjusted market-capitalization-weighted index tracking eligible Canadian equity securities listed on the TSX. Calculated in real time, the index covers approximately 95% of the Canadian equities market and serves as the primary broad-market gauge for Canadian stocks.
The Canadian securities landscape is organized into distinct exchange tiers under provincial regulatory oversight, coordinated nationally through the Canadian Securities Administrators (CSA):
                        ┌──────────────────────────────────────────────┐
                        │      CANADIAN PUBLIC EQUITY ARCHITECTURE     │
                        └──────────────────────┬───────────────────────┘
                                               │
         ┌─────────────────────────────────────┴─────────────────────────────────────┐
         │                                                                           │
         ▼                                                                           ▼
┌──────────────────────────────────────┐                   ┌──────────────────────────────────────┐
│ TORONTO STOCK EXCHANGE (TSX)         │                   │ TSX VENTURE EXCHANGE (TSXV)          │
├──────────────────────────────────────┤                   ├──────────────────────────────────────┤
│ * Senior Equity Market               │                   │ * Junior / Growth Capital Market     │
│ * Large-cap & Mid-cap enterprises    │                   │ * Early-stage exploration & tech     │
│ * Home to S&P/TSX Composite Index    │                   │ * Incubation platform for graduation │
│ * Strict financial & asset tests     │                   │ * Flexible venture capital criteria  │
└──────────────────────────────────────┘                   └──────────────────────────────────────┘
The exchange ecosystem operates on three key institutional principles:
- Dual-Entity Framework: Index administration, mathematics, and methodology maintenance are governed by S&P Dow Jones Indices through the S&P Canadian Index Committee, while exchange operations, trading systems, and market data dissemination are managed by TMX Group.
- Global Mining and Energy Hub: The TSX hosts more listed mining and mineral exploration companies than any other exchange globally, making it a critical capital formation center for basic materials, critical minerals, and traditional energy.
- Integrated Sub-Index Family: The Composite serves as the parent benchmark for specialized market segments, including the blue-chip S&P/TSX 60, the S&P/TSX Completion Index, and capped sector benchmarks.
The Structural Evolution: From TSE 300 to S&P/TSX Partnership

Quick Answer: How Has the Canadian Benchmark Modernized?
Canada’s headline stock index was originally calculated as the TSE 300 Composite Index, established in 1977 and back-calculated to 1945. On May 1, 2002, the Toronto Stock Exchange partnered with S&P Dow Jones Indices to launch the modern S&P/TSX Composite Index, adopting international float-adjustment rules and standardizing governance under the S&P Canadian Index Committee.
The modern history of the Canadian market reflects key structural milestones:
- 1861 (Exchange Inception): The Toronto Stock Exchange is officially formed by a resolution of 24 Canadian businessmen meeting at the Masonic Hall in Toronto.
- 1977 (TSE 300 Launch): The exchange introduces the TSE 300 Composite Index, establishing a standardized 300-constituent equity gauge back-calculated to 1945.
- 1997 (Full Floor Automation): The TSX closes its physical trading floor, becoming one of North America’s earliest major exchanges to shift exclusively to electronic continuous trading.
- 1999 (Exchange Realignment): Canadian exchanges reorganize: Toronto becomes the national senior equities market, Montreal focuses on financial derivatives (Bourse de Montréal), and the Canadian Venture Exchange (now TSXV) forms for junior issuers.
- May 2002 (S&P/TSX Era): S&P Dow Jones Indices assumes operational management of the composite index, retiring the fixed 300-stock rule in favor of a variable-constituent, float-adjusted capitalization methodology.
Eligibility & Inclusion Criteria: Minimum Weight and Liquidity Rules
Quick Answer: What Are the Criteria for S&P/TSX Composite Inclusion?
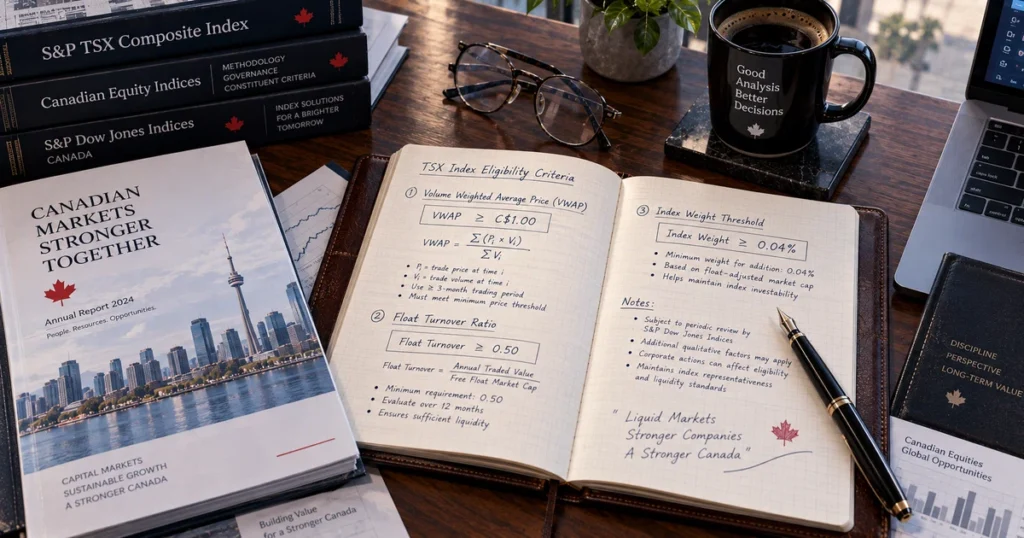
To qualify for addition to the S&P/TSX Composite Index, a security generally must satisfy Canadian domicile or incorporation requirements, meet the index’s minimum float-adjusted market-capitalization and price thresholds, and demonstrate sufficient trading liquidity. New additions generally require at least six full months of TSX trading history, subject to the methodology’s specific eligibility provisions.
The Canadian Index Committee applies quantitative rules during quarterly reviews to determine index additions and maintenance:
1. Domicile and Legal Status
Securities must be listed on the TSX and the issuing company must be domiciled or incorporated in Canada. To qualify for inclusion in the S&P/TSX Composite, securities must also meet the index’s applicable market-capitalization, liquidity, and other eligibility requirements.
2. Market Capitalization Weight Threshold
- Addition Rule: The candidate security must represent a minimum index weight of 0.04% based on its Volume-Weighted Average Price (VWAP) over the 10 trading days preceding the review reference date.
- Buffer / Removal Rule: An existing constituent is considered for removal if its relative index weight drops below 0.025% over the evaluation window.
3. Price Requirement
The candidate stock must maintain a VWAP of at least C$1.00 over the past three months and over the last 10 trading days prior to the index rebalancing reference date.
4. Liquidity & Float Turnover
Trading activity is evaluated using the Float Turnover Ratio, defined as the total number of shares traded in Canada and the U.S. over the previous 12 months divided by float-adjusted shares outstanding at the end of the period:
- Domestic Additions: Minimum float turnover ratio of 0.50.
- Dual-Listed Additions (Canada & US): Minimum float turnover ratio of 0.25 based exclusively on Canadian trading volume, ensuring robust domestic market liquidity.
- Constituent Maintenance: Existing members must maintain sufficient trading liquidity under methodology buffer rules to avoid removal.
5. Eligible vs. Ineligible Securities
The Composite generally excludes preferred shares, warrants, rights, convertible debentures, mutual funds, closed-end funds, and other security types that do not meet the index’s eligibility requirements. Eligible common-equity and qualifying income-trust securities are included subject to the applicable methodology.
Weighting Architecture: Float-Adjusted Capitalization & Divisor Mechanics
Quick Answer: How Is the S&P/TSX Composite Calculated?
The S&P/TSX Composite is calculated using float-adjusted market capitalization weighting. Each company’s index weight is determined by multiplying its current share price by its freely tradable outstanding shares (excluding insider holdings, cross-holdings, and government blocks via the Investable Weight Factor), scaled by an official Index Divisor.
$$\text{Index Level} = \frac{\sum_{i=1}^{N} (P_i \times Q_i \times \text{IWF}_i)}{\text{Divisor}}$$
Where:
- $P_i$ is the current market price of constituent $i$ on the TSX.
- $Q_i$ is the total outstanding share count of constituent $i$.
- $\text{IWF}_i$ is the Investable Weight Factor, representing the percentage of shares freely available to public investors (ranging from 0.0 to 1.0). Strategic insider holdings, controlling family pools, and government blocks holding 5% or more are excluded from the free float.
- $\text{Divisor}$ is the mathematical continuity scaling number adjusted during corporate actions, share issuances, and constituent replacements, matching the core mechanics used in the USA S&P 500.
Price Return vs. Total Return Variants
The benchmark is published in multiple calculation formats:
- Headline S&P/TSX Composite (
^GSPTSE): Calculated as a Price Return index, reflecting pure capital price fluctuations without dividend reinvestment. - S&P/TSX Composite Total Return Index (
^SPTSXTR): Reinvests regular cash dividend distributions back into the index calculation, providing the benchmark for institutional long-term asset performance evaluations, similar to the gross return calculations in the Germany DAX 40.
11 GICS Sector Composition: Financials, Materials, and Energy Dominance

Quick Answer: What Sectors Dominate the Canadian TSX?
Unlike technology-dominated U.S. indices, the S&P/TSX Composite is heavily weighted toward Financials (34.0%), Materials (19.0%), and Energy (16.8%). Together, these three sectors represented roughly 70% of the index as of August 31, 2026, giving the Canadian benchmark significant exposure to banking, mining, and energy markets.
Constituents are categorized under the Global Industry Classification Standard (GICS) across 11 sectors:
| GICS Sector | Weight (As of August 31, 2026) | Primary Economic Role | Representative Blue-Chip Constituents |
| Financials | 34.0% | “Big Six” Canadian chartered banks, life insurers, wealth managers | Royal Bank of Canada (RY), TD Bank (TD), Bank of Montreal (BMO), Scotiabank (BNS), Brookfield (BN) |
| Materials | 19.0% | Gold miners, base metals producers, agricultural fertilizer firms | Barrick Mining Corporation (ABX), Nutrien (NTR), Agnico Eagle Mines (AEM), Teck Resources (TECK.B) |
| Energy | 16.8% | Oil sands producers, pipeline infrastructure, natural gas distributors | Enbridge (ENB), Canadian Natural Resources (CNQ), Suncor Energy (SU), TC Energy (TRP) |
| Industrials | 10.0% | Transcontinental freight rail, aerospace, commercial engineering | Canadian National Railway (CNR), Canadian Pacific Kansas City (CPKC), Thomson Reuters (TRI) |
| Information Technology | 8.0% | Enterprise software, e-commerce infrastructure, IT services | Shopify (SHOP), Constellation Software (CSU), CGI Inc. (GIB.A) |
| Utilities | 3.2% | Regulated electrical utilities, hydroelectric generation, gas grids | Fortis Inc. (FTS), Emera (EMA), Hydro One (H) |
| Consumer Staples | 3.0% | Grocery retail distribution, food processing, packaging | Loblaw Companies (L), Alimentation Couche-Tard (ATD), Metro Inc. (MRU) |
| Consumer Discretionary | 2.9% | Auto parts manufacturing, retail chains, entertainment | Magna International (MG), Dollarama (DOL) |
| Communication Services | 1.6% | National wireless telecom networks, broadband, media networks | BCE Inc. (BCE), Telus Corporation (T), Rogers Communications (RCI.B) |
| Real Estate | 1.2% | Commercial, industrial, and residential income trusts | Canadian Apartment Properties REIT (CAR.UN), RioCan REIT (REI.UN) |
| Health Care | 0.3% | Pharmaceutical distribution, medical diagnostics | Bausch Health Companies (BHC) |
The “Big Six” Banking Concentration
A defining structural characteristic of the Canada TSX is the dominance of Canada’s six largest chartered banks: Royal Bank of Canada (RBC), Toronto-Dominion Bank (TD), Bank of Nova Scotia (Scotiabank), Bank of Montreal (BMO), Canadian Imperial Bank of Commerce (CIBC), and National Bank of Canada. Regulated federally under the Bank Act and supervised by the Office of the Superintendent of Financial Institutions (OSFI), these banks operate within a highly concentrated and tightly regulated banking sector with extensive retail branch networks and wealth-management assets, providing steady dividend cash flows to index allocators.
Macroeconomic Drivers: Bank of Canada Policy, Floating Loonie, and Commodity Cycles
Quick Answer: What Macro Forces Move the Canada TSX?
The TSX is driven by global commodity prices (crude oil, gold, copper, and agricultural nutrients), Bank of Canada (BoC) monetary policy, and the fluctuation of the Canadian Dollar (CAD) against the US Dollar, linking directly to global capital mechanics explored in our study onfed rate cuts and global liquidity.
                      ┌─────────────────────────────────────────┐
                      │    MACRO TRANSMISSION CHANNELS TO TSX   │
                      └────────────────────┬────────────────────┘
                                           │
         ┌─────────────────────────────────┴─────────────────────────────────┐
         │                                                                   │
         ▼                                                                   ▼
┌──────────────────────────────────┐               ┌──────────────────────────────────┐
│ COMMODITY PRICE CYCLES           │               │ MONETARY POLICY & EXCHANGE RATE  │
├──────────────────────────────────┤               ├──────────────────────────────────┤
│ * WTI Crude & WCS Differential:  │               │ * Bank of Canada Interest Rates: │
│   Drives energy sector margins   │               │   Influences mortgage credit and │
│   and pipeline volume cash flow  │               │   commercial banking net interest│
│ * Gold & Copper Benchmarks:      │               │ * Floating Loonie (CAD/USD):     │
│   Impact mining exploration      │               │   Weak CAD boosts exporter value │
│   and capital expenditure cycles │               │   in USD terms for TSX miners    │
└──────────────────────────────────┘               └──────────────────────────────────┘
1. The Commodity Cycle Sensitivity
Because Energy and Materials together represented approximately 35.8% of the index as of August 31, 2026, the TSX has substantial sensitivity to global commodity prices, particularly crude oil, gold, copper, and other metals. Western Canadian Select (WCS) heavy oil differentials and global base metal pricing directly affect operating margins, corporate share buybacks, and capital expenditure programs across Canadian producers.
2. Free-Floating Canadian Dollar (CAD) Dynamics
Unlike currencies with fixed pegs (such as the UAE Dirham examined in our Dubai DFM manual), the Canadian Dollar (CAD, or “Loonie”) is a market-driven, free-floating currency. When the Canadian Dollar depreciates relative to the US Dollar:
- Canadian multinational resource firms and gold miners that generate sales in US Dollars while incurring operational costs in Canadian Dollars experience direct currency-driven margin expansion.
- Conversely, a strengthening Canadian Dollar lowers imported capital equipment costs but can compress USD-denominated revenues when reported back in Canadian Dollars.
3. Bank of Canada Policy and Housing Credit Exposure
Canadian chartered banks carry significant asset exposure to domestic residential real estate mortgages. When the Bank of Canada adjusts policy rates, banking net interest margins shift, while elevated borrowing costs can raise household debt-service ratios, influencing loan-loss provisioning and overall bank equity valuations.
The Dual-Listing Dynamic: TSX and Wall Street Interconnection
Quick Answer: What Is Dual-Listing on the TSX?
A large proportion of Canada’s blue-chip companies maintain simultaneous listings on the Toronto Stock Exchange (in CAD) and major U.S. exchanges such as the New York Stock Exchange or Nasdaq (in USD). Arbitrage trading keeps share prices closely aligned with the prevailing CAD/USD exchange rate.
Prominent dual-listed corporations include Royal Bank of Canada (RY), Enbridge (ENB), Canadian National Railway (CNR), Shopify (SHOP), and Barrick Gold (ABX/GOLD).
+---------------------------------------------------------------------------------------------------+
|                           THE TSX / WALL STREET DUAL-LISTING MECHANISM                            |
+---------------------+-----------------------------+-----------------------+-----------------------+
| FEATURE             | CANADIAN LISTING (TSX)      | U.S. LISTING (NYSE/NAS)| ARBITRAGE MECHANICS  |
+---------------------+-----------------------------+-----------------------+-----------------------+
| **Trading Ticker**  | e.g., `RY.TO`, `SHOP.TO`    | e.g., `RY`, `SHOP`    | Shares are fungible   |
| **Trading Currency**| Canadian Dollars (CAD)      | US Dollars (USD)      | between both markets  |
| **Primary Liquidity**| Domestic retail & Canadian | U.S. institutions &   | Market makers track   |
|                     | pension funds (CPPIB, CDPQ) | global ETF complexes  | cross-border spreads  |
+---------------------+-----------------------------+-----------------------+-----------------------+
Cross-Border Arbitrage Mechanics
Dual-listed shares maintain price alignment across active market sessions:
$$\text{Price}_{\text{TSX (CAD)}} \approx \text{Price}_{\text{US (USD)}} \times \text{Exchange Rate}_{\text{CAD/USD}}$$
If a temporary pricing discrepancy emerges between Toronto and U.S. quotes, quantitative market makers and other arbitrageurs may buy the relatively lower-priced security and sell the relatively higher-priced security, subject to transaction costs, foreign-exchange effects, execution risk, and other market frictions. This arbitrage activity generally helps keep dual-listed prices closely aligned after accounting for the CAD/USD exchange rate.
Trading Mechanics: Market Sessions, Crosses, and Order Types

Quick Answer: When Does the Toronto Stock Exchange Trade?
The TSX operates Monday through Friday, with regular continuous electronic trading running from 9:30 AM to 4:00 PM Eastern Time (ET). Pre-market order entry begins at 7:00 AM ET, with closing facility matching concluding at 4:00 PM ET.
Daily Trading Schedule (Eastern Time – ET):
- 07:00 – 09:30 AM ET (Pre-Open Session): Order entry, cancellation, and modification. The trading engine computes an Indicative Calculated Opening Price (COP) based on order book balance without executing fills.
- 09:30 AM ET (Market Open / Opening Match): Opening cross matching executes, establishing the official opening price, followed immediately by continuous trading.
- 09:30 AM – 04:00 PM ET (Continuous Trading Session): Electronic matching operates continuously across TSX-listed equities.
- 03:50 – 04:00 PM ET (Market On Close – MOC Facility): The MOC facility handles closing-order imbalance and price discovery into the official closing match. A freeze period begins between approximately 3:56 and 3:57 PM, followed by the closing match at 4:00 PM unless a Price Movement Extension is required.
- 04:00 PM ET (Market Close): The closing auction match determines the official closing price.
- 04:15 – 05:00 PM ET (Extended Market Session): Unfilled resting limit orders can trade at the established last sale price.
Canadian Equity Order Priority: Broker Preferencing
A distinctive feature of the TSX matching engine is Broker Preferencing. Under the TSX’s Price/Broker/Long Life/Time priority framework, an incoming attributed order can receive priority to match a similarly priced order from the same broker before comparable orders from other brokers are considered by time priority. Anonymous and Jitney orders are excluded from broker-preferencing opportunities.
Benchmark Variations: S&P/TSX Composite vs. S&P/TSX 60
Quick Answer: What Is the Difference Between the S&P/TSX Composite and the S&P/TSX 60?
The S&P/TSX Composite is a broad-market index tracking roughly 215–240 large and mid-cap Canadian companies covering approximately 95% of the market. The S&P/TSX 60 is a concentrated blue-chip index tracking 60 of the largest, most liquid Canadian leaders, designed specifically for derivative hedging and large-scale ETF replication.
| Benchmark Feature | S&P/TSX Composite Index (^GSPTSE) | S&P/TSX 60 Index (^TX60) |
| Constituent Count | Variable (~215 – 240 constituents) | Fixed (Exactly 60 constituents) |
| Market Coverage | ~95% of Canadian equities market | ~73% of Canadian equity market capitalization |
| Target Market Cap | Large-Cap and Mid-Cap Canadian equities | Large-Cap mega-cap Canadian blue chips |
| Primary Benchmark ETF | iShares Core S&P/TSX Capped Composite (XIC) | iShares S&P/TSX 60 Index ETF (XIU) |
| Derivatives Contracts (MX) | S&P/TSX Composite Index Mini Futures (SCF) | S&P/TSX 60 Standard Futures (SXF) / Mini (SXM) |
| Rebalancing Frequency | Quarterly (March, June, Sept, Dec) | Quarterly (March, June, Sept, Dec) |
How to Gain Exposure to the Canada TSX
Quick Answer: How Do Investors Invest in the Canadian Stock Market?
Investors access the TSX through direct equity share purchases on the exchange, cross-listed shares on the NYSE/Nasdaq, or broad Canadian equity Exchange-Traded Funds (ETFs) traded across North American brokerages.
+---------------------------------------------------------------------------------------------------+
|                        CANADIAN TSX INVESTMENT & TRADING ACCESS ROUTES                            |
+---------------------+-----------------------------+-----------------------+-----------------------+
| ACCESS VEHICLE      | TICKER / EXAMPLE            | CURRENCY & VENUE      | TARGET INVESTOR       |
+---------------------+-----------------------------+-----------------------+-----------------------+
| **Direct TSX ETF**  | iShares S&P/TSX 60 (`XIU`)  | CAD on TSX            | Domestic Canadian     |
|                     | Vanguard FTSE Canada (`VCN`)|                       | allocators & RRSP/TFSA|
| **U.S.-Listed ETF** | iShares MSCI Canada (`EWC`) | USD on NYSE Arca      | Global & US investors |
|                     |                             |                       | seeking CAD exposure  |
| **Dual-Listed Blue  | Royal Bank of Canada (`RY`) | CAD on TSX            | Active stock pickers, |
| Chips**             | Enbridge (`ENB`), CPKC (`CP`)| USD on NYSE          | dividend investors    |
+---------------------+-----------------------------+-----------------------+-----------------------+
Tax Considerations: The Canadian Non-Resident Withholding Tax
For international investors holding Canadian-listed dividend-paying stocks directly, Canada levies a standard 25% statutory non-resident withholding tax on cash distributions. Under bilateral tax treaties (such as the US-Canada or Canada-UK tax conventions), this withholding tax is generally reduced to 15%, and is frequently waived for qualified U.S. retirement accounts (such as traditional 401k or IRA structures).
Comparative Analysis: S&P/TSX Composite vs. Global Peers
Quick Answer: How Does the Canadian TSX Compare to the S&P 500, DAX 40, and DFMGI?
The TSX is characterized by significant exposure to financials, materials, and energy. Compared with tech-heavy U.S. benchmarks, its sector mix gives investors greater exposure to banks, commodity producers, and energy companies, while many large Canadian companies also have established dividend-paying histories. This composition can provide different diversification and inflation-sensitive exposures, but it does not guarantee defensive performance or act as a reliable inflation hedge in all market conditions.
| Dimension / Metric | Canada S&P/TSX Composite | USA S&P 500 (SPX) | Germany DAX 40 (DAX) | Dubai DFMGI (DFMGI) |
| Constituents | ~215–240 Canadian stocks | 500 Large-Cap US firms | 40 Major German firms | Eligible DFM equities |
| Weighting Method | Float-Adjusted MCap | Float-Adjusted MCap | Free-Float MCap | Free-Float MCap (FFF) |
| Primary Currency | Canadian Dollar (CAD) | US Dollar (USD) | Euro (EUR) | UAE Dirham (AED) |
| Headline Return Type | Price Return | Price Return | Total Return (Gross) | Price Return |
| Top Sector Bias | Financials, Materials & Energy | Information Technology | Industrials & Autos | Financials & Real Estate |
| Constituent Cap | None (Capped on select sub-indices) | None (Modified float) | 15% Maximum Cap | 10% Maximum Cap |
| Trading Hours (Local) | 09:30 – 16:00 ET | 09:30 – 16:00 ET | 09:00 – 17:30 CET | 10:00 – 14:45 GST |
Common Myths vs. Empirical Facts
- Myth: The TSX is only a resource exchange for small junior exploration companies.
- Fact: While the junior TSX Venture Exchange (TSXV) focuses on early-stage exploration, the senior TSX hosts some of North America’s most capitalized financial institutions, pipeline conglomerates, and enterprise software firms alongside large-cap mining leaders.
- Myth: The S&P/TSX Composite still requires exactly 300 stocks.
- Fact: The fixed 300-constituent rule was retired on May 1, 2002, when S&P assumed management from the TSE 300. The Composite constituent count is variable and floats based on companies satisfying objective eligibility rules.
- Myth: Canadian companies dual-listed on the NYSE trade independently of Canadian share prices.
- Fact: High-frequency market makers and institutional desks execute cross-border arbitrage, ensuring dual-listed share prices stay aligned after accounting for the CAD/USD exchange rate.
- Myth: The TSX headline index automatically includes reinvested dividends.
- Fact: The headline S&P/TSX Composite (
^GSPTSE) is calculated on a Price Return basis. Investors tracking dividend accumulation must consult the S&P/TSX Composite Total Return Index (^SPTSXTR).
- Fact: The headline S&P/TSX Composite (
Frequently Asked Questions
What does “TSX” stand for?
TSX stands for the Toronto Stock Exchange, the senior public equities marketplace in Canada, headquartered in Toronto, Ontario, and operated by TMX Group.
What is the difference between the TSX and the TSX Venture Exchange (TSXV)?
The TSX is Canada’s senior exchange for mature, large-cap, and mid-cap companies meeting strict revenue and asset standards. The TSXV is a public venture capital incubator for early-stage exploration, technology, and emerging growth enterprises.
Who calculates the S&P/TSX Composite Index?
The index is calculated, maintained, and governed by S&P Dow Jones Indices through the S&P Canadian Index Committee, in operational partnership with TMX Group.
How often is the S&P/TSX Composite rebalanced?
The index undergoes scheduled quarterly rebalancings in March, June, September, and December to evaluate constituent weights, verify float turnover liquidity, and adjust for corporate capital changes.
Are dividends included in the headline S&P/TSX Composite?
No. The standard quoted index is a Price Return measure. A separate Total Return Index (^SPTSXTR) accounts for the reinvestment of regular cash dividends.
What are the “Big Six” Canadian banks on the TSX?
The “Big Six” banks are Royal Bank of Canada (RY), Toronto-Dominion Bank (TD), Bank of Nova Scotia (BNS), Bank of Montreal (BMO), Canadian Imperial Bank of Commerce (CM), and National Bank of Canada (NA).
Strategic Summary & Core Takeaways
- North American Capital Anchor: The Canada TSX is the senior equities exchange of Canada, operated by TMX Group and covering roughly 95% of the Canadian equities market.
- Standardized S&P Governance: Managed by S&P Dow Jones Indices since 2002, the Composite employs float-adjusted market capitalization weighting, a C$1.00 VWAP floor, a 0.04% minimum weight threshold, and quarterly rebalancings.
- Macroeconomic Sensitivity: With heavy allocations to Financials (34.0%), Materials (19.0%), and Energy (16.8%), the TSX provides built-in exposure to global industrial commodity cycles and dividend income.
- Dual-Listing Fluidity: Extensive cross-listings on the NYSE and Nasdaq establish deep cross-border liquidity, keeping prices closely aligned via market arbitrage and the CAD/USD exchange rate.
- Microstructure Framework: Electronic execution runs from 9:30 AM to 4:00 PM ET, distinguished by Broker Preferencing and the Market On Close (MOC) price discovery auction beginning at 3:50 PM ET.
Next Reading Suggestions
- USA S&P 500: The Complete Guide to Index Methodology, Market-Cap Weighting, and Global Market Mechanics
- Germany DAX 40: The Complete Guide to Components, Total Return Methodology, and Global Market Mechanics
- Dubai Financial Market (DFM): The Complete Guide to the DFMGI Index, Methodology, and Market Structure
- How Stock Prices Are Determined: Market Microstructure, Supply and Demand, and Valuation
- What Is Market Capitalization? The Complete Guide to Market Cap, Company Size, and Valuation
- Interest Rates and Exchange Rates: The Complete Guide to Global Currency Pricing
- Fed Rate Cuts & Global Liquidity: The Complete Guide to Interest Rates, the Fed Balance Sheet, and Asset Markets
- What Is Gold? The Complete Guide to Real Money, Store of Value & Why It Matters
Author Box & E-E-A-T Verification
Written & Researched By: CurrencyPlans Editorial Research Team
Editorial Review & Methodological Standards: This Canadian equity market manual is developed from primary exchange rulebooks, regulatory filings, and quantitative index methodology publications. Structural parameters—including the S&P Canadian Index Committee guidelines, float-adjusted capitalization algorithms, float turnover liquidity ratios, GICS sector assignments, and continuous trading rules—have been verified against official documentation published by TMX Group, S&P Dow Jones Indices, the Canadian Securities Administrators (CSA), and the Bank of Canada.
Educational References & Market Data Sources
For official index rulebooks, constituent updates, and trading calendars, consult primary regulatory and exchange portals directly:
- Toronto Stock Exchange (TMX Group Issuer Resources & Portal): TMX Group
- S&P Dow Jones Indices (S&P/TSX Canadian Indices Methodology): S&P Dow Jones Indices
- Bank of Canada (Monetary Policy, Interest Rates & CAD Statistics): Bank of Canada
- Canadian Securities Administrators (CSA Regulatory Framework): CSA
- Office of the Superintendent of Financial Institutions (OSFI Bank Regulation): OSFI
- Bourse de Montréal (Canadian Financial Derivatives & Futures): Bourse de Montréal
Educational Disclaimer
This guide is prepared strictly for educational, research, and informational purposes and does not constitute personalized financial, investment, trading, or tax advice. Equities, regional indices, and dual-listed securities carry investment risks. Historical performance of the S&P/TSX Composite Index does not guarantee future financial returns. Always conduct independent due diligence and consult a licensed fiduciary advisor before allocating investment capital.

