
Executive Summary & Core Thesis
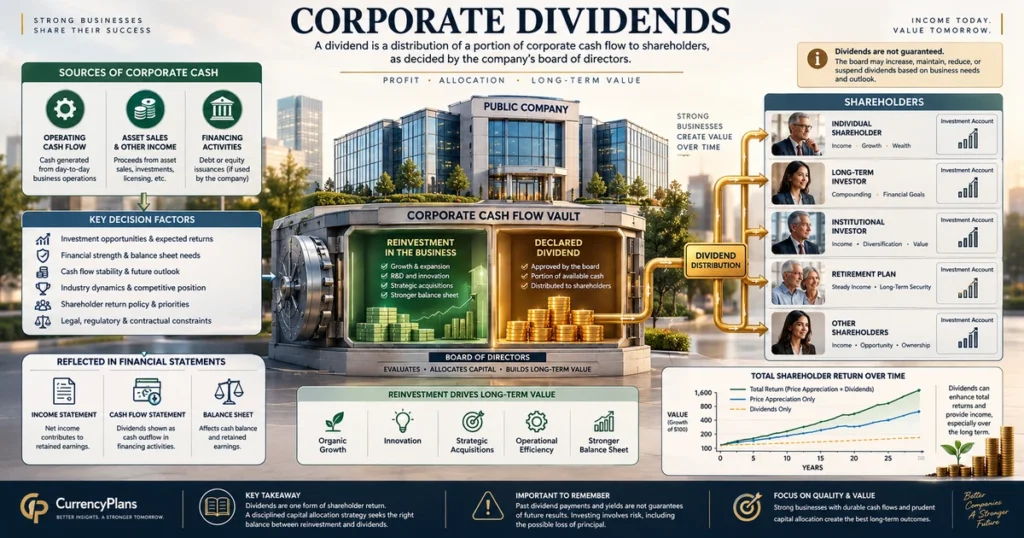
A dividend is a distribution of a portion of a corporation’s earnings declared by the board of directors and paid to eligible shareholders. When an individual or institution purchases common or preferred stock, they acquire fractional equity ownership in an operating enterprise. When that enterprise generates surplus profits beyond its operational and reinvestment requirements, management may elect to distribute a portion of that cash directly to shareholders.
In global capital markets, dividends fulfill two essential economic functions: they provide investors with tangible, recurring cash flow returns on invested capital, and they can impose capital allocation discipline on corporate executives. However, sound dividend analysis requires avoiding simplistic yield-chasing: an unusually high dividend yield is not an indicator of safety or high future returns. Sustainable dividend investing requires evaluating operational free cash flow coverage, balance sheet leverage, business model durability, and tax implications across multi-year macroeconomic cycles.
The Foundational Definition: What Is a Dividend?
Quick Answer: What Is a Dividend?
A dividend is a distribution declared by a company’s board of directors and paid to eligible shareholders, typically in cash or, in some cases, additional shares or other property. Dividends can provide investors with recurring cash income and contribute to total return alongside changes in the share price. Companies are not generally required to pay dividends, and payout amounts can change based on financial performance, investment requirements, liquidity, and capital-allocation decisions.
In corporate finance and securities law, dividends represent payments made by a corporation to its equity shareholders out of current net earnings or accumulated retained earnings.
When you invest in a company, as detailed in our guide on what stocks are, you acquire a fractional claim on the business’s net assets and economic output. A corporation that operates profitably faces a fundamental capital allocation decision regarding its net cash flow:
- Reinvestment in Growth: Deploying cash into research and development (R&D), capital expenditures (CapEx), hiring, or corporate mergers.
- Balance Sheet Optimization: Paying down existing debt obligations or building cash reserves to improve solvency.
- Direct Shareholder Returns: Returning surplus cash directly to equity owners via cash dividends or open-market share buybacks.
Many mature corporations, such as established blue chip stocks, balance these objectives by funding internal operations and expansion while distributing surplus free cash flow to investors.
How Dividends Work: The Corporate Capital Flow
Dividends are not automatic; they follow a formal governance process established by corporate charters and securities regulations.
                      ┌─────────────────────────────────────────┐
                      │        GROSS CORPORATE REVENUES         │
                      └────────────────────┬────────────────────┘
                                           │
                        (Minus Operating Expenses, Interest & Tax)
                                           ▼
                      ┌─────────────────────────────────────────┐
                      │              NET PROFIT                 │
                      └────────────────────┬────────────────────┘
                                           │
                        (Board Evaluates Cash Flow, Reinvestment & Payout)
                                           ▼
         ┌─────────────────────────────────┴─────────────────────────────────┐
         │                                                                   │
         ▼                                                                   ▼
┌──────────────────────────────────┐               ┌──────────────────────────────────┐
│ RETAINED / REINVESTED CASH       │               │     DECLARED CASH DIVIDENDS      │
│ (CapEx, R&D, debt reduction,     │               │  (Distributed to eligible        │
│  acquisitions, or other needs)   │               │   shareholders of record)        │
└──────────────────────────────────┘               └──────────────────────────────────┘
The board of directors reviews financial performance, capital requirements, and macroeconomic conditions. If the board approves a dividend, it formally declares the payment amount per share, the payment currency, and the calendar schedule governing which shareholders qualify for the distribution.
Once declared, a cash dividend becomes an official liability on the corporate balance sheet until paid.
The Dividend Timeline: Declaration, Ex-Dividend, Record, and Payment Dates
Quick Answer: The Dividend Timeline
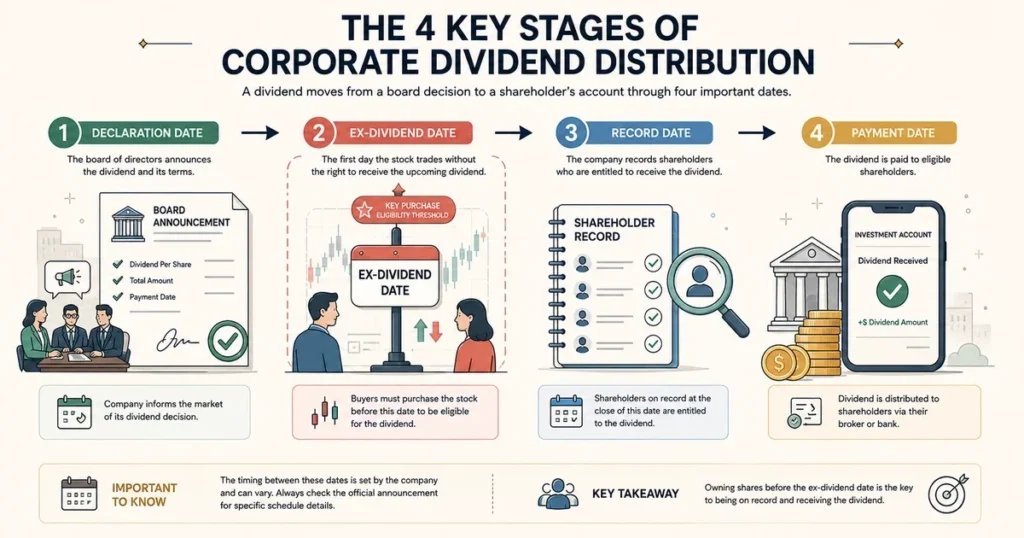
Receiving a dividend depends on four specific calendar milestones: the Declaration Date (when the board announces the payout), the Ex-Dividend Date (the cutoff date where new buyers generally do not receive the dividend), the Record Date (when the company audits its shareholder ledger), and the Payment Date (when funds are deposited). To receive an upcoming dividend, an investor must typically purchase shares before the ex-dividend date.
To prevent confusion and ensure orderly trade settlement across public exchanges, securities regulators and market operators establish a standardized sequence for dividend distributions. For example, in the United States, the dates are generally structured as follows:
| Dividend Milestone | Operational Definition | Practical Investor Rule |
| 1. Declaration Date | The date the board of directors announces the dividend amount, record date, and payment date. | Confirms the payout amount and establishes the upcoming distribution schedule. |
| 2. Ex-Dividend Date | The date on or after which a purchaser generally does not receive the upcoming dividend. For most ordinary U.S. cash dividends, the ex-dividend date is generally the same business day as the record date under the current T+1 settlement cycle. To receive the dividend, an investor generally must purchase the shares before the ex-dividend date. | To receive the dividend, an investor generally must purchase the shares before the ex-dividend date. |
| 3. Record Date | The date by which an investor must be officially registered on the corporate shareholder ledger to receive the distribution. | Established by the board of directors in the dividend declaration. |
| 4. Payment Date | The date on which the company transfers cash dividends to brokerage accounts or issues new shares. | Cash is deposited into your brokerage account or automatically reinvested via DRIP. |
The Ex-Dividend Date and Price Adjustment
On the ex-dividend date, the stock’s market price may adjust downward by approximately the dividend amount to reflect the value of the distribution, although actual price movements are determined by market supply, demand, and other information.
Because the company distributes cash to shareholders, its cash balance and net assets are reduced by the amount of the distribution, subject to the accounting and transaction details involved. The price adjustment reflects the fact that a buyer acquiring the stock on or after the ex-dividend date generally does not receive the upcoming distribution.
To explore how continuous order books handle market supply and demand, review our guide on how stock prices are determined.
Forms of Dividends: Cash, Stock, and Property Distributions
While standard cash distributions represent the vast majority of corporate payouts, dividends can be structured across multiple formats:
1. Cash Dividends
The most common format. The corporation transfers cash directly to brokerage accounts on the payment date on a per-share basis (e.g., $0.75 per share held).
2. Stock Dividends (Bonus Shares)
Instead of distributing cash, the corporation issues additional fractional or whole shares to existing shareholders (e.g., a 5% stock dividend provides 5 additional shares for every 100 shares held). While the company’s total equity value remains unchanged, stock dividends capitalize retained earnings and expand the total number of shares outstanding.
3. Property Dividends & Special Distributions
- Property Dividends: The distribution of physical assets, inventory, or shares of a spun-off subsidiary company directly to equity owners.
- Special (One-Time) Dividends: Non-recurring cash payouts funded by extraordinary events, such as asset sales, a significant cash surplus, or the resolution of legal claims.
Core Financial Metrics: Dividend Yield and Dividend Payout Ratio
Quick Answer: Yield vs. Payout Ratio
- Dividend Yield: The annual cash dividend expressed as a percentage of the current share price, measuring immediate income return.
- Dividend Payout Ratio: Measures dividends relative to a specified earnings or cash-flow measure, such as net income or free cash flow, helping investors assess the portion of internally generated resources being distributed.
- Analysis Rule: Evaluate dividend yield alongside earnings and free cash flow payout measures, while also considering balance-sheet strength, capital requirements, business cyclicality, and dividend history.
Institutional analysts assess dividend attractiveness and safety using two primary mathematical formulas:
1. Dividend Yield
Dividend yield measures the annual cash income generated relative to the prevailing share price:
$$\text{Dividend Yield} = \left( \frac{\text{Annual Dividend Per Share}}{\text{Current Market Share Price}} \right) \times 100$$
Example: If a stock trades at $50.00 per share and pays a quarterly dividend of $0.50 ($2.00 annually), its dividend yield is:
$$\text{Dividend Yield} = \left( \frac{\$2.00}{\$50.00} \right) \times 100 = 4.0\%$$
Because share price sits in the denominator, a dividend yield will rise when a stock price falls, even if corporate fundamentals deteriorate.
2. Dividend Payout Ratio (Earnings vs. Cash Flow)
The payout ratio measures the proportion of corporate profits dedicated to dividend payments:
$$\text{Earnings Payout Ratio} = \left( \frac{\text{Total Dividends Paid}}{\text{Net Income}} \right) \times 100$$
Because net income includes non-cash accounting items, institutional analysts prioritize the Free Cash Flow (FCF) Payout Ratio:
$$\text{FCF Payout Ratio} = \left( \frac{\text{Total Dividends Paid}}{\text{Free Cash Flow}} \right) \times 100$$
When free cash flow is zero or negative, the FCF payout ratio may be undefined or economically difficult to interpret; investors should then examine operating cash flow, capital expenditures, liquidity, debt capacity, and the reasons for the cash-flow shortfall.
Comparing dividends with free cash flow after capital expenditures provides a practical measure of whether distributions are supported by internally generated cash flow. Where maintenance capital expenditures are estimated separately, investors should recognize that such estimates can vary by business and analyst methodology.
The Dual Engine of Return: Dividend Yield vs. Dividend Growth
Quick Answer: Yield vs. Dividend Growth
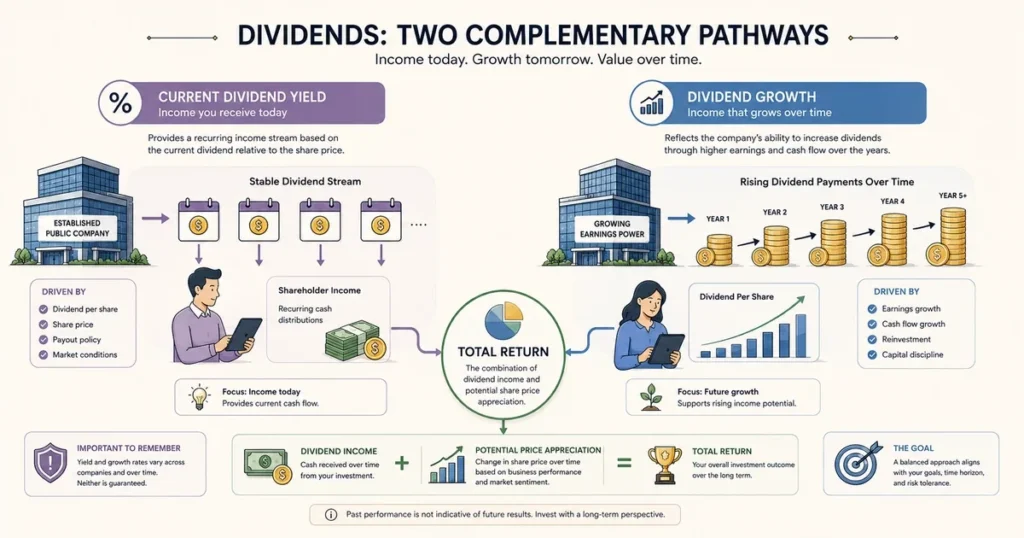
- High-Yield Stocks: Companies offering relatively high current dividend yields, which may reflect mature businesses, sector characteristics, or elevated risk.
- Dividend Growth Stocks: Companies with lower or moderate starting yields but a consistent history or expectation of increasing dividends over time.
- Long-Term Compounding: Sustained dividend growth can materially increase future income and total returns, although outcomes depend on valuation, earnings growth, reinvestment, and dividend sustainability.
Investors approach dividend investing through different strategies depending on their financial objectives and time horizons:
- Current Income Focus (High-Yield): Prioritizes companies with established, higher immediate yields to satisfy current cash flow needs, typically in mature sectors such as utilities, consumer staples, or real estate.
- Dividend Growth Focus: Prioritizes companies with robust earnings expansion and competitive economic moats that regularly raise dividend distributions, driving multi-year compounding.
Yield on Cost (YOC)
For long-term investors, the concept of Yield on Cost illustrates the potential of dividend growth compounding:
$$\text{Yield on Cost} = \left( \frac{\text{Current Annual Dividend Per Share}}{\text{Original Purchase Price Per Share}} \right) \times 100$$
If you purchase a share for $50 paying a $1 dividend (2% initial yield), and over the subsequent 10 years the company increases its dividend to $5 per share, your effective Yield on Cost becomes 10% on your original invested capital, regardless of where the stock price trades today.
Elite Dividend Classifications: Aristocrats and Kings
Quick Answer: Dividend Royalty
- S&P 500 Dividend Aristocrats: S&P 500 companies that have increased their regular annual dividend distributions for at least 25 consecutive years, subject to formal index rules.
- Dividend Kings: An informal market term used for corporations that have raised their dividend payouts for 50 or more consecutive years.
- Key Takeaway: While multi-decade dividend growth indicates historical operational resilience, past increases do not guarantee future dividend growth or the sustainability of the current payout.
Certain corporations distinguish themselves by maintaining continuous dividend increases across multiple economic cycles, recessions, and inflation environments:
- S&P 500 Dividend Aristocrats: Public corporations in the S&P 500 index that have increased their cash dividend payout every year for at least 25 consecutive years, subject to the index’s methodology and eligibility requirements.
- Dividend Kings: An informal market term commonly used for public companies that have raised their annual dividend distributions for 50 or more consecutive years; definitions and lists can vary by source.
- Dividend Achievers / Challengers: Method-dependent classifications for growing enterprises with consecutive annual dividend increases over shorter periods (e.g., 10 or 5 years).
While these track records provide useful historical perspective, investors must continuously verify that current free cash flow generation supports ongoing distribution growth.
The Power of Compounding: Dividend Reinvestment Plans (DRIP)
Quick Answer: What Is a DRIP?
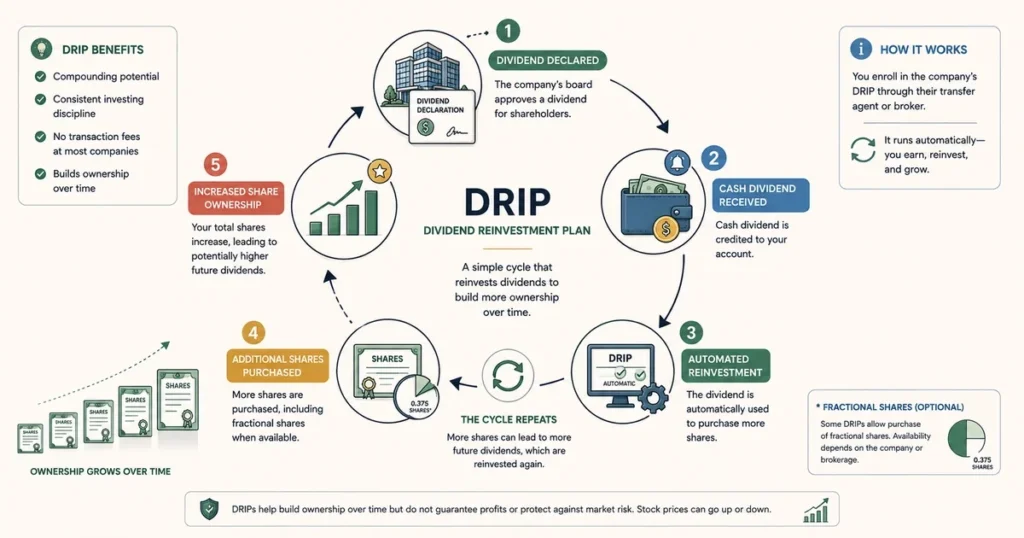
A Dividend Reinvestment Plan (DRIP) is an automated feature offered by some brokerages and corporate issuers that uses cash dividend distributions to purchase additional shares, which may include fractional shares depending on the applicable plan or brokerage terms. By automatically reinvesting distributions, investors can increase their share count over time without manually placing each reinvestment order, subject to the terms and fees of the applicable brokerage or issuer plan.
Enrolling in a Dividend Reinvestment Plan (DRIP) is one method for systematic compounding over long investment horizons:
                 ┌─────────────────────────────────────────┐
                 │    INITIAL PORTFOLIO SHARE HOLDINGS     │
                 └────────────────────┬────────────────────┘
                                      │
                   (Company Declares Cash Dividend Payout)
                                      ▼
                 ┌─────────────────────────────────────────┐
                 │       CASH DIVIDEND DISTRIBUTED         │
                 └────────────────────┬────────────────────┘
                                      │
                   (Automated Brokerage DRIP Reinvestment)
                                      ▼
                 ┌─────────────────────────────────────────┐
                 │      ADDITIONAL SHARES PURCHASED        │
                 └────────────────────┬────────────────────┘
                                      │
               (Expanded Share Base Generates Larger Dividends)
                                      ▼
                 ┌─────────────────────────────────────────┐
                 │     COMPOUNDING DIVIDEND ENGINE         │
                 └─────────────────────────────────────────┘
The Mathematics of Automated Share Accumulation
When stock prices decline during broader market corrections, an active DRIP purchases more shares with each dividend distribution at the lower prevailing share price. If prices later recover, the investor owns a larger total share count, which can support long-term compounding as detailed in our guide on how to invest in stocks.
Dividend Stocks vs. Growth Stocks: Strategic Allocation
Quick Answer: Dividends vs. Growth
Dividend-paying stocks distribute part of their cash flow to shareholders and may provide recurring income, while growth stocks often prioritize reinvesting a larger share of their resources into business expansion and may pay limited or no dividends. Dividend payments do not inherently make a stock less volatile or safer, and portfolio construction should consider valuation, business quality, risk, and investment horizon.
Investors balance their equity portfolios between income-producing dividend equities and high-reinvestment growth stocks:
| Strategic Dimension | Dividend-Paying Stocks | High-Growth Stocks |
| Total Return Driver | Cash yield plus potential earnings growth | Capital appreciation from commercial scaling |
| Capital Allocation | Distributes recurring cash to shareholders | Often prioritizes internal expansion reinvestment |
| Corporate Maturity | Established, mature industry participants | Scaling, disruptive, or emerging phase |
| Share Price Volatility | Volatility varies by company, sector, and valuation | Often higher, but varies substantially by company |
| Macro Rate Sensitivity | Often attractive relative to stable bond yields | Sensitive to discount rate adjustments |
To explore how benchmark rates alter equity valuations, review our analysis on interest rates and exchange rates.
Dividend Sustainability: Assessing Free Cash Flow and Balance Sheet Safety
A high stated dividend yield is meaningless if the underlying company cannot sustain its payments. Institutional analysts examine three core financial pillars to assess dividend safety:
1. Free Cash Flow vs. Net Income Alone
Cash dividends are ultimately paid from available cash, not accounting net income alone. If a company reports positive net income but generates weak operating cash flow or negative free cash flow because of working-capital requirements, heavy capital expenditures, or other cash demands, the dividend may require support from existing cash balances or external financing. Persistent reliance on such sources can raise concerns about long-term dividend sustainability.
2. Debt Maturity and Solvency Profile
When corporate debt matures or carries variable interest rates, higher prevailing rates can increase refinancing or interest costs. For highly leveraged companies, these higher financing costs can reduce cash available for dividends and other capital-allocation priorities.
3. Business Cyclicality and Pricing Power
Companies in defensive or regulated sectors, such as consumer staples and regulated utilities, may experience relatively more stable cash flows than highly cyclical businesses, although individual companies can still face operational, regulatory, commodity-cost, or demand-related pressures. In contrast, highly cyclical commodity producers or industrial manufacturers experience significant earnings volatility, making rigid dividend growth difficult to sustain during downturns.
The High-Yield Trap: When an Unusually High Dividend Yield Signals Distress
Quick Answer: Dividend Value Traps
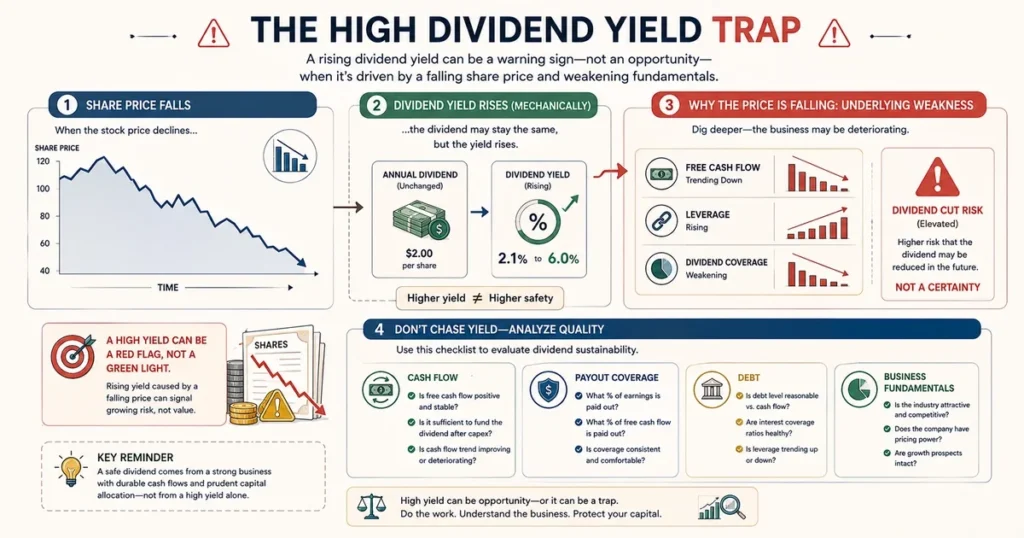
A dividend value trap occurs when a stock displays an unusually high dividend yield relative to the company’s historical range, sector peers, or broader market because its share price has collapsed due to deteriorating business fundamentals. Because dividend yield rises when the share price falls, a collapsing stock price can create an artificially inflated yield—often shortly before the board of directors cuts or eliminates the dividend payout.
One of the most significant hazards in dividend investing is chasing elevated yields without investigating corporate fundamentals:
- Artificially Inflated Optical Yield: A sharp price drop mechanically increases the dividend yield calculation ($\text{Yield} = \frac{\text{Dividend}}{\text{Price}}$), masking underlying operational distress.
- FCF Payout Ratio Approaching or Exceeding 100%: The company may be distributing most or more of its recurring free cash flow, leaving less internal cash for reinvestment, debt reduction, and resilience during downturns.
- Rising Net Debt to Fund Distributions: Management issues corporate bonds or borrows on credit lines to cover cash dividend commitments.
- Credit Rating Downgrades: Agencies downgrade the company’s debt toward non-investment grade, significantly increasing borrowing costs.
Taxation of Dividends: Qualified vs. Ordinary Distributions
Quick Answer: Dividend Taxes
Dividend taxation depends on your country of tax residence, the type of account holding the shares, and how long you have held the stock. In taxable accounts under U.S. federal rules, dividends are typically taxed as either qualified dividends (subject to long-term capital gains tax rates) or ordinary dividends (taxed as ordinary income). Placing dividend stocks in tax-advantaged accounts can provide tax-deferred or tax-exempt growth, subject to the account’s rules.
Tax efficiency significantly impacts net compound returns over multi-decade investment horizons:
1. Qualified vs. Ordinary Dividends (US Framework Example)
- Qualified Dividends: Dividends from domestic corporations or qualified foreign corporations that meet specific holding-period requirements (such as holding the underlying stock for more than 60 days during a specified 121-day period surrounding the ex-dividend date). Under U.S. federal rules, qualified dividends are taxed at preferential long-term capital gains tax rates.
- Ordinary (Non-Qualified) Dividends: Dividends that do not meet the requirements for qualified-dividend treatment are generally taxed as ordinary income under U.S. federal rules. Certain REIT distributions, partnership-related payments, and other distributions can receive different tax treatment, so investors should review the applicable tax reporting and rules.
2. Tax-Advantaged Account Shielding
Tax treatment varies by account type and jurisdiction. In some tax-advantaged accounts, dividends can generally be reinvested without creating an immediate annual tax liability, subject to the account’s specific rules.
How to Evaluate a Dividend Stock: A Step-by-Step Investor Checklist
Quick Answer: Evaluation Checklist
To systematically analyze a dividend stock, evaluate five core criteria: 1) Verify a multi-year history of consistent or growing dividend payments, 2) Assess the Free Cash Flow payout ratio in the context of the company’s business model and capital requirements, 3) Check that interest coverage and debt leverage are manageable relative to industry peers, 4) Assess the durability of the company’s competitive economic moat, and 5) Evaluate valuation multiples relative to historical and sector-specific benchmarks.
Investors evaluating an individual company for dividend quality should follow a structured five-stage assessment framework:
- Stage 1: Dividend Track Record Audit: Verify multi-year payment consistency and evaluate historical distribution growth rates across different economic cycles.
- Stage 2: Cash Flow Coverage Check: Assess the Free Cash Flow payout ratio relative to the company’s business model, capital expenditure requirements, and cyclicality.
- Stage 3: Balance Sheet Solvency Review: Inspect debt maturity schedules, liquidity reserves, and interest coverage ratios relative to industry peers.
- Stage 4: Economic Moat Assessment: Confirm pricing power, competitive advantages, and market standing that protect ongoing operational cash generation.
- Stage 5: Valuation Multiple Review: Compare P/E, EV/EBITDA, and cash flow yields against historical baselines and sector medians to avoid overpaying.
For a comprehensive guide on executing stock orders and building diversified portfolios, explore our tutorial on how to invest in stocks.
Frequently Asked Questions (Institutional FAQ)
What is the simplest definition of a dividend?
A dividend is a distribution declared by a company’s board of directors and paid to eligible shareholders, typically in cash, providing shareholders with a return of capital alongside potential share-price appreciation.
Are all public companies required to pay dividends?
No. Companies are not legally obligated to pay dividends. Corporate boards evaluate whether to distribute cash or retain earnings to fund internal business operations, acquisitions, debt repayment, or research.
What happens to a stock’s price on the ex-dividend date?
On the ex-dividend date, the stock’s market price may adjust downward by approximately the dividend amount to reflect the value of the distribution, although actual price movements are determined by market supply, demand, and other incoming financial news.
What is a safe dividend payout ratio?
A sustainable payout ratio depends on the company’s industry, capital intensity, cyclicality, balance sheet, and cash-flow requirements. Rather than applying a universal threshold, investors should compare the payout ratio with historical levels, industry peers, recurring free cash flow, debt obligations, and expected reinvestment needs.
Can a company cut or eliminate its dividend?
Yes. Corporate boards can reduce or suspend dividend payments at any time if cash flow deteriorates, debt burdens rise, or economic conditions warrant capital preservation.
Strategic Summary & Institutional Takeaways
Understanding what dividends are establishes a foundational framework for analyzing corporate finance, capital allocation, and long-term portfolio construction.
Dividends convert corporate productivity and commercial innovation into tangible cash returns for shareholders. By analyzing dividend coverage through free cash flow, monitoring balance sheet leverage, and harnessing the potential of automated Dividend Reinvestment Plans (DRIPs), investors build compounded income returns over long horizons.
However, disciplined dividend investing requires avoiding the trap of chasing optical high yields. By prioritizing corporate quality, sustainable free cash flow payout ratios, and multi-year dividend growth, investors harness the wealth-building potential of equity markets with structured risk management and a multi-decade perspective.
Next Reading Suggestions
- What Are Stocks? The Complete Guide to Shares, Equity, and Ownership
- What Are Blue Chip Stocks? The Complete Guide to Quality, Dividends, and Long-Term Investing
- How to Invest in Stocks: The Complete Step-by-Step Guide for Beginners and Long-Term Investors
- How Stock Prices Are Determined: Market Microstructure, Supply and Demand, and Valuation
- What Is the Stock Market? How Global Equity Markets Work and Allocate Capital
- What Is a Stock Exchange? How Exchanges Work, Trade Stocks, and Settle Transactions
Author Box & E-E-A-T Verification
Written By: CurrencyPlans Financial Research Team
Fact-Checked & Reviewed By: Financial Research Team & Equity Editorial Board
Editorial Integrity & Research Standards: CurrencyPlans publishes educational research grounded in established corporate-finance principles, financial economics, and publicly available regulatory and institutional resources. All capital market taxonomy, corporate governance frameworks, balance sheet solvency metrics, and valuation models are cross-referenced with primary multilateral institutions and securities regulatory frameworks, including the US Securities and Exchange Commission (SEC), the Financial Industry Regulatory Authority (FINRA), and the World Federation of Exchanges (WFE).
Primary Institutional References & Regulatory Resources
For official investor education, market regulation standards, and statutory consumer protection rules, consult primary institutional sources directly:
- Investor Education & Dividend Disclosure Guidelines: US Securities and Exchange Commission (SEC) – Investor.gov
- Broker Verification & Market Conduct Rules: Financial Industry Regulatory Authority (FINRA) – BrokerCheck
- Global Securities Exchanges Architecture & Data: World Federation of Exchanges (WFE)
- International Financial Stability & Capital Market Research: Bank for International Settlements (BIS)
- Global Macroeconomic Statistics & Capital Flow Data: International Monetary Fund (IMF) Data Portal
Educational Disclaimer
This guide is prepared strictly for educational, informational, and research purposes and does not constitute personalized financial, investment, legal, or tax advice. Equities and capital market instruments carry inherent risk of capital loss, price volatility, and business failure. Past performance does not guarantee future results. Always perform independent due diligence and consult a licensed, fiduciary financial advisor before making investment commitments.

