
Introduction
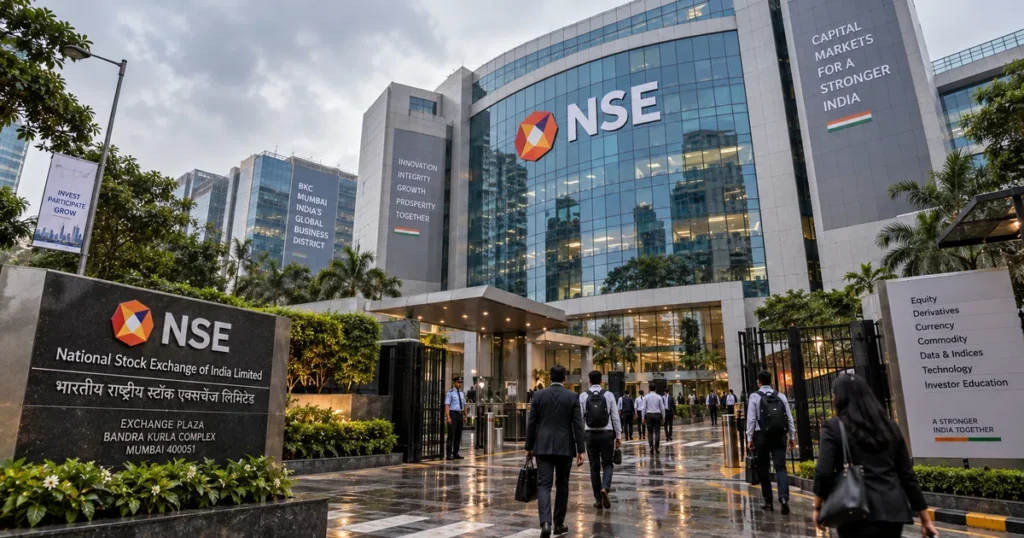
If you felt this week was brutal on your portfolio, you weren’t imagining things. The Indian stock market logged its fifth straight weekly decline, marking its longest continuous losing streak of 2026.
On Friday, September 11, the NSE Nifty 50 dropped 79.70 points (-0.34%) to finish at 23,398.10, while the 30-share BSE Sensex retreated 120.83 points (-0.16%) to close at 74,781.76.
Between persistent foreign investor selling, spiking international oil prices from Middle East friction, and valuation fatigue in high-flying domestic sectors, Dalal Street bulls spent the week playing defense. Here is the complete breakdown of what happened on Friday, how the weekly numbers stack up, and the exact technical zones you need to watch heading into Monday, grounded in the mechanics of how stock prices are determined.
The Friday Scorecard: Official Index Performance
What Happened on Friday?
Dalal Street woke up to a gap-down opening after GIFT Nifty slipped toward 23,346. The Nifty 50 touched an intraday low of 23,231.40 before an afternoon recovery in banking heavyweights pulled the index up over 160 points. It wasn’t enough to turn green, but it defended key intraday supports to close at 23,398.10.
The verified cash market numbers across all major benchmark tiers:
| Index | Segment / Coverage | Previous Close | Friday Open | Day High | Day Low | Friday Close | Net Change | Day Change (%) |
| Nifty 50 | 50 Large-Cap Leaders | 23,477.80 | 23,270.30 | 23,448.10 | 23,231.40 | 23,398.10 | -79.70 | -0.34% |
| BSE Sensex | 30 Blue-Chip Giants | 74,902.59 | 74,309.16 | 74,845.30 | 74,160.16 | 74,781.76 | -120.83 | -0.16% |
| Nifty Midcap 100 | Top 100 Liquid Midcaps | 62,357.35 | 61,988.20 | 62,264.00 | 61,374.45 | 62,197.20 | -160.15 | -0.26% |
| Nifty 500 | Broad Market (~92.0% Float MCap) | 22,952.35 | 22,774.05 | 22,894.25 | 22,672.95 | 22,866.50 | -85.85 | -0.37% |
| Nifty 200 | Large + Midcap Universe | 13,707.86 | 13,595.90 | 13,676.60 | 13,543.70 | 13,657.90 | -49.95 | -0.36% |
| Nifty Next 50 | Junior Large-Caps (51–100) | 72,530.90 | 71,926.55 | 72,235.20 | 71,400.50 | 72,083.70 | -447.20 | -0.62% |
| Nifty Smallcap 50 | High-Beta Emerging | 10,005.85 | 9,941.50 | 9,959.40 | 9,859.30 | 9,948.20 | -57.65 | -0.58% |
The 5-Week Slump: Zooming Out on the Trend
How Big Is the Damage Over the Past Month?
For the week ended September 11, the Nifty 50 shed 2.09% and the BSE Sensex dropped 2.27%. Over the past 30 days, the pullback has stretched to -4.39% for Nifty and -4.32% for Sensex, demonstrating a broad-based correction across Indian equities.
                      ┌─────────────────────────────────────────┐
                      │    5-WEEK BEARISH MACRO TRANSMISSION    │
                      └────────────────────┬────────────────────┘
                                           │
         ┌─────────────────────────────────┴─────────────────────────────────┐
         │                                                                   │
         ▼                                                                   ▼
┌──────────────────────────────────┐               ┌──────────────────────────────────┐
│ GLOBAL COMMODITY & FX SHOCKS     │               │ INSTITUTIONAL FLOWS & VALUATIONS │
├──────────────────────────────────┤               ├──────────────────────────────────┤
│ * Brent Crude Spike:             │               │ * Steady FPI Net Outflows:       │
│   Escalating Middle East tension │               │   Foreign funds continue taking  │
│   inflates import bills & deficit│               │   money off the table in equities│
│ * Rupee Depreciation Pressure:   │               │ * Lofty Domestic Multiples:      │
│   Strong US Dollar Index (DXY)   │               │   Rich P/E ratios leave zero room│
│   pressures emerging currencies  │               │   for minor earnings misses      │
└──────────────────────────────────┘               └──────────────────────────────────┘
When you step back and look at the broader 52-week price structure, the context becomes clear:
- Nifty’s High-to-Low Channel: The index has pulled back 11.28% from its all-time high of 26,373.20, while remaining above its 52-week low of 22,182.55.
- Sensex Retracement: The Sensex is down roughly 13.20% from its record peak of 86,159.02, reflecting a broader combination of valuation pressure, global risk aversion, and weakness across major sectors.
The Macro Problem: Middle East Tension & The $10 Crude Rule

Why Does Expensive Oil Hurt Indian Stocks So Fast?
India imports over 85% of its crude oil. When geopolitical conflict flares up in the Middle East, higher tanker rates and elevated barrel prices can increase India’s import bill, weaken the Rupee, and stir up inflation—constraining the Reserve Bank of India’s room for aggressive interest rate cuts.
Whenever Brent crude tests multi-month highs, three distinct headwinds hit the domestic market at once:
- Trade Deficit Strain: A sustained $10 increase per barrel adds billions of dollars to India’s annual import bill, which naturally increases downward pressure on the Indian Rupee (INR).
- Raw Material Pain for Input Sectors: Companies reliant on petroleum derivatives—paints, tires, specialty chemicals, lubricants, and airlines—see immediate margin compression because they cannot instantly pass these costs on to consumers.
- Monetary Policy Limitations: Higher fuel and transportation costs feed straight into consumer inflation expectations. That can constrain the RBI’s room for policy easing, delaying rate cuts and keeping borrowing costs elevated, a reality thoroughly explored in our guide on interest rates and exchange rates.
Friday Session Microstructure: The Intraday Rebound & Sector Drags
Which Sectors Hurt the Most, and What Limited the Downside?
Nifty Metal and Nifty Realty were among Friday’s weakest sectors, pressured by global demand concerns and elevated borrowing costs. In contrast, gains in private banking leaders—led by HDFC Bank (+2.08%)—and selected pharmaceutical stocks provided support during the afternoon recovery.
The Movers & Shakers:
- The Downside Drags:
- Nifty Metal: Sank on softer international commodity demand and margin worries for domestic steelmakers.
- Nifty Realty: Traded under pressure as sticky borrowing rates raised questions about near-term urban housing demand.
- Nifty Next 50 (-0.62%): Underperformed the frontline index, reflecting profit booking across mid-tier industrial and consumer discretionary names.
- The Defensive Anchors:
- HDFC Bank (+2.08%): Provided critical support during the afternoon session, absorbing sell orders near established valuation zones.
- Dr. Reddy’s Laboratories (+1.97%): Attracted defensive capital rotation, alongside steady accumulation in large-cap healthcare.
- Tech Mahindra (+1.00%): Stayed resilient alongside select IT exporters benefiting from currency movements.
Technical Roadmap: Key Levels & Institutional Strategy for Next Week

What Are the Must-Watch Levels for Monday?
Mark 23,200 as line-in-the-sand support on the downside; a breakdown here opens the path toward the 22,800–22,180 zone. On the upside, 23,600 is immediate resistance, followed by a heavy barrier at 23,850–24,000.
1. The Derivatives Picture (Open Interest)
Options chain positioning on the NSE provides clues into institutional sentiment:
- Call Open Interest at 23,500–23,600: Elevated call open interest at these strikes highlights an important near-term resistance area, although open interest alone does not establish the direction or intent of individual option positions.
- Put Open Interest at 23,200 & 23,000: Concentrated put open interest around these strikes identifies potential support zones, but the positioning should be interpreted alongside price action and changes in open interest.
2. Moving Averages Reality Check
The Nifty 50 remains below its 20-day, 50-day, and 100-day Exponential Moving Averages (EMAs). As of September 11, the 20-day EMA was around 24,000, while the 50-day and 100-day EMAs were around 24,090 and 24,148, respectively. A sustained daily close above the 20-day EMA would be an initial sign of short-term stabilization, while reclaiming the higher moving averages would provide stronger confirmation. The 23,600 area can therefore be monitored as an intermediate resistance zone alongside broader price-action and derivatives signals.
Global Perspective: How India Compares to Worldwide Benchmarks
Is This Just an Indian Market Correction?
Not entirely, but India is feeling localized pressure from crude dependency and valuation normalization. Mature benchmarks like the USA S&P 500 and Germany DAX 40 are currently navigating their own policy and tech-earnings cycles.
| Benchmark | India Nifty 50 (^NSEI / NSE) | USA S&P 500 (SPX) | Germany DAX 40 (DAX) | Dubai DFMGI (DFMGI) |
| Weekly Trend | 5th Straight Loss (-2.09%) | Mixed / Consolidated | Range-bound | Capped / Defensive |
| Core Macro Concern | Crude Oil & FPI Outflows | AI CapEx & Fed Path | Industrial Demand & Energy | US Interest Rate Peg |
| Heavyweight Bias | Financials (~33%) & IT | Big Tech & Hyperscalers | Industrials & Autos | Financials & Real Estate |
| Headline Level | 23,398.10 | Large-Cap US | Large-Cap Export | Regional Middle East |
| Return Type | Price Return | Price Return | Total Return (Gross) | Price Return |
Strategic Summary & Core Takeaways
- Five Weeks in the Red: Indian equities logged their fifth consecutive weekly drop, with Nifty down 2.09% (23,398.10) and Sensex down 2.27% (74,781.76).
- Oil Is the Primary Headwind: Spiking crude prices from Middle East friction are directly hitting India’s import dynamics, consumer inflation expectations, and corporate margins.
- Defensive Banking Support: Private banking resilience, led by HDFC Bank’s +2.08% move, contributed to the afternoon recovery after the Nifty 50 touched an intraday low of 23,231.40.
- FPI Capital Outflows: Foreign portfolio investors remained net sellers of Indian equities through the week, while domestic institutional buying helped absorb part of the selling pressure.
- Key Levels for Next Week: Watch 23,200 as the critical line in the sand. Any recovery toward 23,600–23,800 should be monitored alongside the elevated call open interest and broader price-action signals.
Next Reading Suggestions
- USA S&P 500: The Complete Guide to Index Methodology, Market-Cap Weighting, and Global Market Mechanics
- Germany DAX 40: The Complete Guide to Components, Total Return Methodology, and Global Market Mechanics
- Canada TSX: The Complete Guide to the S&P/TSX Composite Index, Methodology, and Market Structure
- Dubai Financial Market (DFM): The Complete Guide to the DFMGI Index, Methodology, and Market Structure
- How Stock Prices Are Determined: Market Microstructure, Supply and Demand, and Valuation
- What Is Market Capitalization? The Complete Guide to Market Cap, Company Size, and Valuation
- Interest Rates and Exchange Rates: The Complete Guide to Global Currency Pricing
- Fed Rate Cuts & Global Liquidity: The Complete Guide to Interest Rates, the Fed Balance Sheet, and Asset Markets
Author Box & E-E-A-T Verification
Written & Researched By: CurrencyPlans Editorial Research Team
Editorial Review & Market Analysis Standards: This weekly market report is compiled using verified cash and derivative trade data from the National Stock Exchange of India (NSE), the Bombay Stock Exchange (BSE), and macroeconomic indicators published by the Reserve Bank of India (RBI) and global commodity exchanges.
Educational References & Market Data Sources
- National Stock Exchange of India (NSE Cash & Derivatives Feeds): NSE India
- BSE India (Sensex Official Index & Market Data): BSE India
- Reserve Bank of India (Monetary Policy & Foreign Exchange Reserves): RBI
Educational Disclaimer
This market analysis is prepared strictly for educational, research, and informational reporting purposes and does not constitute personalized financial, investment, or trading advice. Equity investments and derivative trading carry capital risks. Past market performance does not guarantee future results. Always consult a SEBI-registered investment advisor before deploying capital.

