

Bitcoin is currently trading inside a tightly compressed intraday liquidity environment, where price continues rotating around value without delivering any confirmed directional expansion. The broader execution profile remains balanced, but the internal order flow tells a more complex story.
Price is holding above both VWAP and 20EMA, which normally signals localized buyer stability. But beneath that surface, the futures layer shows something entirely different—fresh short exposure is being introduced into the market while spot demand remains passive.
This mismatch between price structure and derivatives aggression creates a high-friction environment.
When this kind of structure appears, professional traders stop looking for momentum and start studying absorption.
The market right now is not trending. It is negotiating.
That distinction matters.
Institutional participants are currently operating inside a compressed range between $63,600 and $64,755, with execution clustering tightly around the session Point of Control at $64,056.
That tells us one thing:
Value has been accepted.
And when value gets accepted, the next thing traders watch is who loses patience first.
Observed Runtime: Live Futures Session (UTC)
Market Snapshot Table
| Market Metric | Live Reading |
|---|---|
| Asset Pair | BTCUSDT |
| Current Price | $64,178.00 |
| 24H High | $64,755.60 |
| 24H Low | $63,600.40 |
| Trend Structure | Range Consolidation |
| EMA20 Position | Above EMA20 |
| VWAP Position | Above VWAP |
| Relative Volume | Moderate Compression |
| Liquidity Regime | Rotational Compression |
The market remains mechanically balanced. Neither side has taken full intraday control, and that is visible through both volatility compression and lack of liquidation activity.
A 0.44% Bollinger width confirms the environment is still tight.
This matters because compressed markets tend to create deceptive movement—small pushes feel meaningful, but unless structure breaks, they often revert back into value.
That is exactly what Bitcoin is doing now.
Active Structural Conditions
| Execution Signal | Status / Order Flow Psychology |
|---|---|
| Price Above VWAP | Average session longs remain in favorable territory |
| Price Above EMA20 | Local trend support remains active |
| Rising Open Interest + Negative CVD | Fresh shorts entering while price remains stable |
This combination is where things get interesting.
Normally, if price remains above VWAP and EMA20, sellers should struggle.
But the negative CVD at -1.34 tells us aggressive market sells are still active.
That means buyers are not attacking.
They are absorbing.
Absorption without expansion creates pressure.
And pressure inside compression is what builds liquidity traps.
Intraday Boundary Check (At A Glance)
Bitcoin remains almost perfectly centered inside its 24-hour execution range.
This is one of the cleanest rotational distributions visible in the current session.
Price is sitting 577 points below the high and 577 points above the low.
That symmetry matters.
It shows that neither side has dominated enough to distort the auction.
Boundary Metrics
| Metric | Reading |
|---|---|
| Distance Below 24H High | 577.60 Points |
| Distance Above 24H Low | 577.60 Points |
| Value Area High (VAH) | $64,184.11 |
| Value Area Low (VAL) | $63,927.89 |
| Session POC | $64,056.00 |
The most important thing here is current price relative to VAH.
Bitcoin is trading almost directly on the upper value boundary.
That usually means two things:
- Buyers are testing value acceptance higher.
- Sellers are defending inventory at premium pricing.
If buyers were aggressive enough, price would separate from value.
But it hasn’t.
That means supply remains active.
There has also been no liquidity sweep, meaning neither the high nor low has been aggressively raided.
This keeps the market structurally clean.
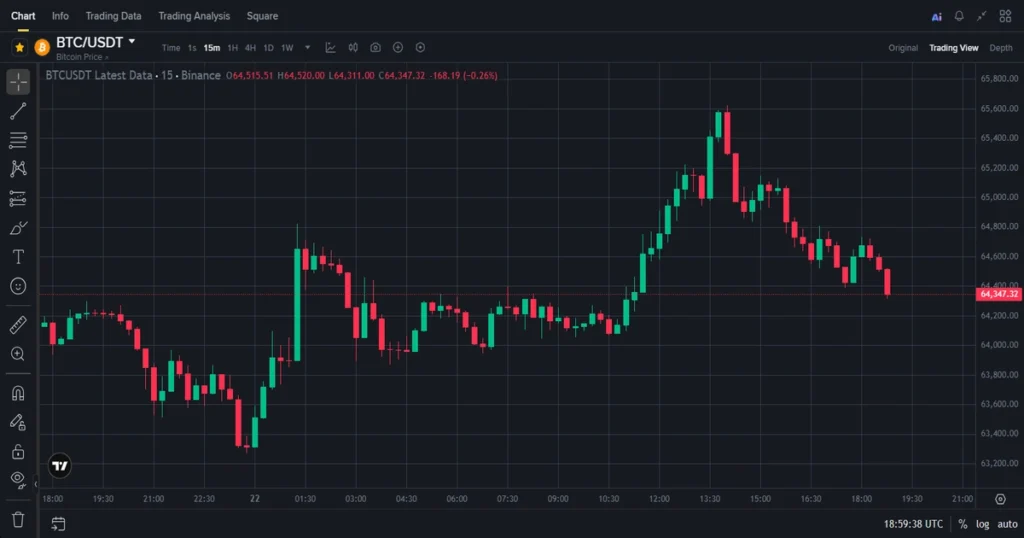
15-Min Live Execution & Trend Breakdown
The footprint data shows the strongest internal clue of the entire session.
Order Flow Dashboard
| Metric | Reading |
|---|---|
| Live CVD | -1.34 |
| Buyer Absorption | +17.32 BTC |
| Seller Aggression | -22.04 BTC |
| Net Footprint Delta | -4.72 BTC |
| OI+CVD Classification | New Short Positions Injected |
At first glance, negative delta looks bearish.
But context matters.
Seller aggression at -22.04 BTC is stronger than buyer absorption.
Yet price hasn’t broken down.
That means one of two things:
Either buyers are stronger than they appear, or sellers are inefficient.
This inefficiency is critical.
Professional traders track this constantly.
When sellers hit aggressively but fail to move price materially, it usually signals absorption at lower levels.
But we cannot call that bullish.
Because OI is rising.
And rising OI with negative CVD confirms fresh short exposure entering.
Not closing.
Opening.
That distinction separates weak selling from active positioning.
This is why the current environment remains highly mechanical.
Not emotional.
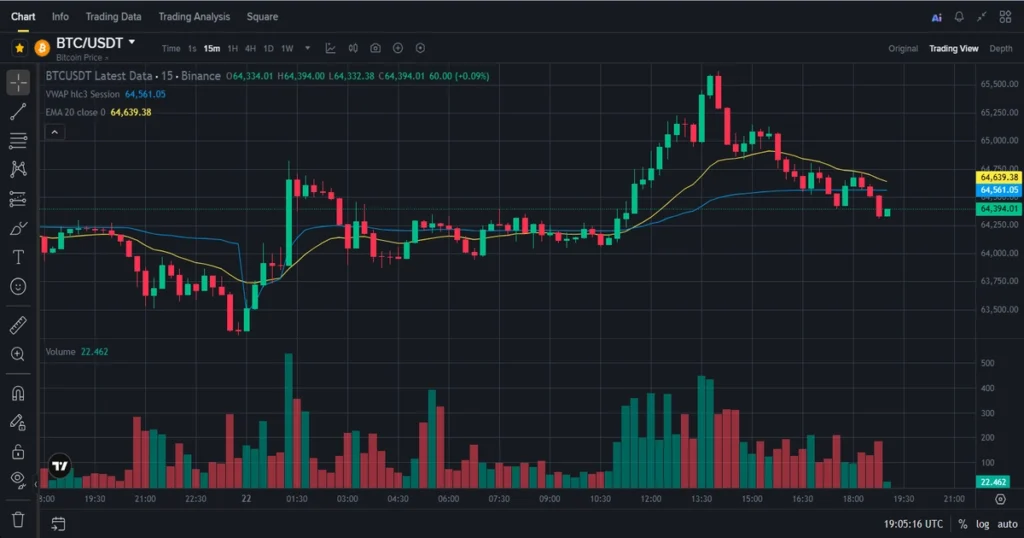
Institutional Gravity — EMA20 & VWAP Interaction
Price remains above both the 20EMA and session VWAP.
This is the strongest structural support in the current intraday framework.
Structural Positioning
| Baseline | Current Status | Dynamic Market Control |
|---|---|---|
| EMA20 | Above | Buyers maintaining short-term trend structure |
| VWAP | Above | Session inventory remains favorable for longs |
Trading above VWAP tells us average executed buyers are still profitable.
That changes psychology.
Profitable longs defend.
Losing longs panic.
Right now, there’s no panic.
That’s why despite seller aggression, price remains stable.
The 20EMA adds another layer.
It acts as a localized dynamic support baseline.
Price holding above both baselines while OI expands creates tension.
This is why the market feels slow.
It is processing leverage.
Not price discovery.
That’s a major difference.
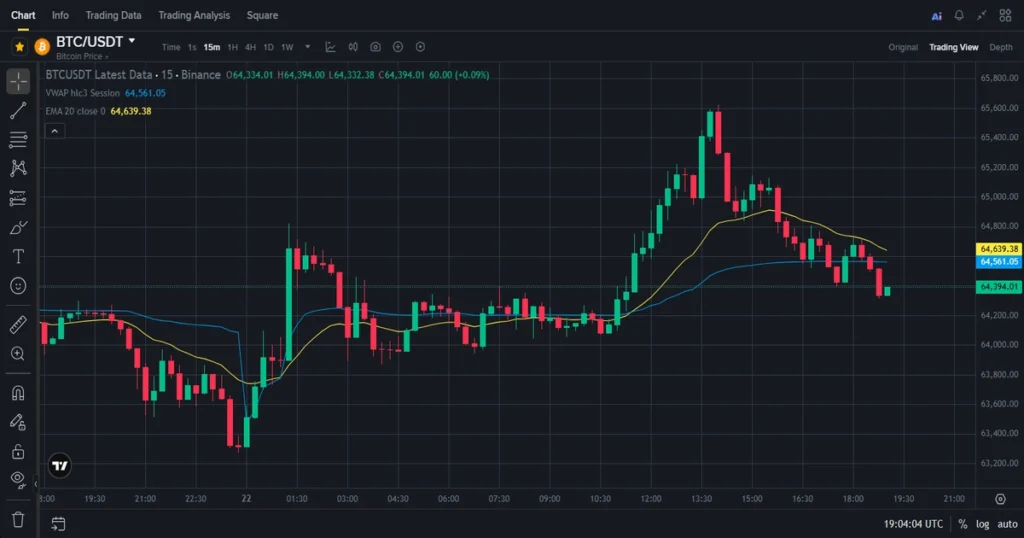
Detection Matrix Module
This section tells us how much participation is entering the market.
And right now, participation is growing.
Detection Matrix
| Detection Metric | Reading / Live Observation |
|---|---|
| OI 24H Shift | +8.76% |
| OI 1H Change | +2.41% |
| Liquidation Alerts | 0 Blocks Flushed |
| BOS / CHOCH Status | No BOS / Neutral CHOCH |
| Composite Confidence | 59% Neutral |
The most important number here is +8.76% OI expansion.
That is not passive.
That is capital entering.
But no liquidation events means nobody has been forced out yet.
That means conviction remains stable.
And when conviction remains stable inside a range, the market stores energy.
No BOS means no structural break.
No CHOCH means no reversal trigger.
So structurally, the market remains neutral.
Liquidity Concentration Zones
| Liquidity Cluster | Price Level |
|---|---|
| Long Liquidation Zone | $63,600.40 |
| Short Liquidation Zone | $64,755.60 |
| Largest Cluster Concentration | $127,579 USD |
These zones matter because they represent trapped leverage.
Not support.
Not resistance.
Just trapped capital.
And trapped capital becomes fuel.
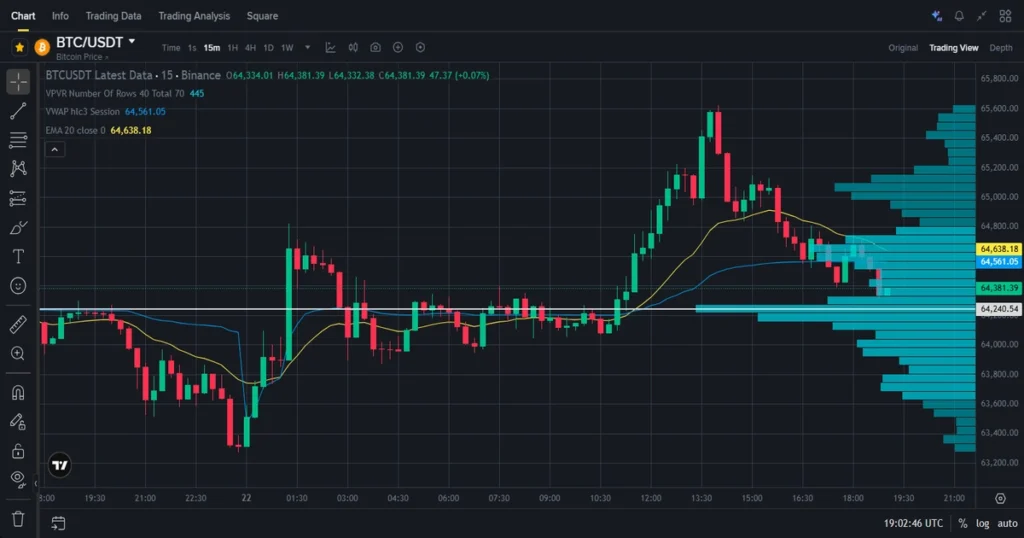
Derivatives Layer Behavior
Funding remains positive at +0.0087%.
That tells us long-side capital still dominates carry cost.
But the long/short account ratio at 0.88 tells a different story.
Retail accounts are leaning short.
Top traders remain net long at 1.58.
This divergence is important.
Retail and professional positioning are currently split.
That often creates messy execution.
Not because one side is right.
But because both sides keep reloading.
The basis spread is almost flat at -$0.01.
This confirms there’s no meaningful arbitrage dislocation.
Spot and futures are tightly aligned.
That usually happens when the market is waiting.
Not moving.
Key Technical Observations
- Session POC remains centered at $64,056.00
- Current price remains directly near VAH
- Bollinger Band Width remains compressed at 0.44%
- Open Interest expanded +2.41% in 1H
- Open Interest expanded +8.76% in 24H
- Funding remains positive at +0.0087%
- Seller aggression exceeds buyer absorption by 4.72 BTC
- No liquidation flushes detected
- No liquidity sweeps confirmed
- Spot-futures basis remains flat
FAQ Section
What does trading above VWAP indicate?
It means average buyers are still profitable, which often creates stronger defensive behavior.
Why is rising OI important?
It shows new capital entering the market, increasing leverage participation.
Why does negative CVD matter?
It shows aggressive selling pressure through market orders.
What does volatility compression tell traders?
It tells traders the market is balancing inside tighter ranges.
What does No BOS mean?
It means no structural breakout has occurred.
Technical Conclusion
Bitcoin remains in a pure auction environment.
Value is accepted.
Leverage is increasing.
Aggressive sellers are active, but price remains structurally supported above both VWAP and EMA20.
That tells us this market is currently absorbing more than it is expanding.
The most important takeaway is simple:
This is not a directional market yet.
It is a negotiation between passive buyers and aggressive sellers.
And until that negotiation breaks, the range remains the dominant structure.
What was your cleanest 15-minute execution today?
Financial Disclaimer
This article is for educational and market commentary purposes only. It is not financial advice, investment guidance, or a trading recommendation. Always do your own research before making trading decisions.

