
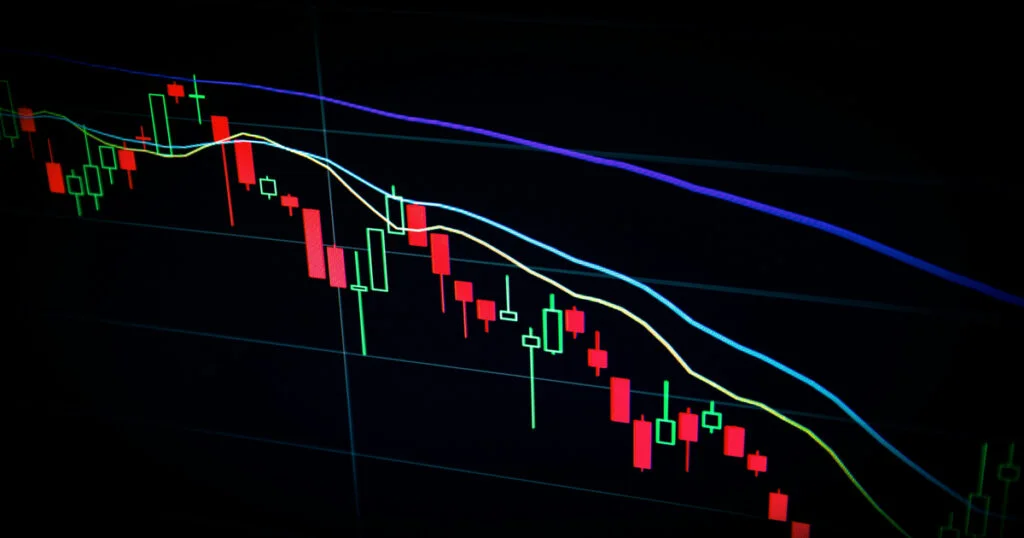
Bitcoin continues to trade inside a structurally compressed environment, with the current session reflecting a classic liquidity balancing phase rather than aggressive directional expansion. Price action remains tightly contained within the established intraday value area, while order flow metrics show localized buyer activity being absorbed into persistent sell-side pressure.
At the center of today’s execution, the most important detail is the conflict between positive live CVD (+4.19) and falling open interest. That combination often signals that spot-side buyers are participating, but leveraged market participants are reducing exposure rather than building conviction. When this happens while price remains below both VWAP and 20EMA, it usually reflects a market still operating under seller-led control despite temporary internal buying attempts.
The broader derivatives layer supports this reading. Funding remains negative at -0.0042%, the total open interest pool has contracted, and the long-to-short ratio remains under equilibrium at 0.88. These are not expansion metrics. These are compression metrics.
Observed Runtime: UTC Live Session Feed
Market Snapshot Table
| Market Metric | Live Reading |
|---|---|
| Asset Pair | BTCUSDT |
| Current Price | $62,309.49 |
| 24H High | $62,870.30 |
| 24H Low | $61,748.70 |
| Trend Structure | Range Consolidation |
| EMA20 Position | Below EMA20 |
| VWAP Position | Below VWAP |
| Relative Volume | Weak Participation |
| Liquidity Regime | Compression |
Active Structural Conditions
| Execution Signal | Status / Order Flow Psychology |
|---|---|
| Below VWAP | Sellers maintain average session control |
| Below EMA20 | Intraday momentum remains capped |
| Weak Participation | Thin market conditions limit directional commitment |
Bitcoin’s current structure is not driven by urgency. It is driven by hesitation.
That distinction matters.
When price trades below both VWAP and EMA20 at the same time, it means the average buyer from this session is currently underwater while short-term momentum remains defensive. In practical terms, every upward move faces overhead inventory pressure from trapped longs.
That pressure is visible in the footprint.
Intraday Boundary Check (At A Glance)
Bitcoin remains positioned almost perfectly in the center of its active 24-hour trading envelope, creating a balanced rotational structure. Price currently sits between the high and low with almost identical distance on both sides, which confirms that the market is still searching for acceptance rather than rejecting value.
Boundary Metrics
| Metric | Reading |
|---|---|
| Distance Below 24H High | 560.81 Points |
| Distance Above 24H Low | 560.79 Points |
| Value Area High (VAH) | $62,524.80 |
| Value Area Low (VAL) | $62,275.20 |
| Session POC | $62,400.00 |
The symmetry here is important.
Price is trading almost equally between the upper and lower liquidity boundaries, meaning neither side has established dominance strong enough to push outside accepted value. The POC at $62,400 remains the center of gravity, showing the highest traded acceptance during the session.
This tells us one thing clearly:
The market is comfortable here.
When price is comfortable, it rotates.
Not trends.
That rotational behavior usually reflects inventory exchange between participants rather than aggressive imbalance.

15-Min Live Execution & Trend Breakdown
The footprint is where the real story sits.
While the live CVD is positive at +4.19, footprint absorption shows that buyers are working harder than sellers — and still losing the efficiency battle.
Order Flow Dashboard
| Metric | Reading |
|---|---|
| Live CVD | +4.19 |
| Buyer Absorption | +10.63 BTC |
| Seller Aggression | -13.53 BTC |
| Net Footprint Delta | -2.90 BTC |
| OI+CVD Classification | LONG LIQUIDATION ESCAPE FLOW |
Positive CVD usually means aggressive buying is entering the tape.
But here’s the catch:
Price is not expanding higher.
That means the buying pressure is being absorbed.
This is one of the cleanest institutional reads inside today’s session.
Buyers are active, but they are not strong.
Sellers are allowing buys to hit into them while maintaining price suppression. That creates a net negative footprint delta, even while spot flow remains positive.
The OI + CVD classification labels this as Long Liquidation Escape Flow, which means some participants are exiting weak longs instead of building new positions.
That reduces fuel.
And reduced fuel inside compression keeps the range intact.

Institutional Gravity — EMA20 & VWAP Interaction
Bitcoin remains below both structural gravity points.
This is one of the strongest non-directional signals in today’s tape.
Structural Positioning
| Baseline | Current Status | Dynamic Market Control |
|---|---|---|
| EMA20 | Below | Short-term trend pressure remains defensive |
| VWAP | Below | Average session execution favors sellers |
Trading below VWAP means the average executed participant of the session holds inventory at a worse price than current value.
That changes psychology.
Anyone who bought above VWAP is now holding loss-based inventory. When price rotates back into those levels, those traders often sell to reduce risk.
This creates supply.
The same logic applies to the 20EMA.
The moving average acts as short-term momentum equilibrium. When price cannot reclaim it, that means the market continues accepting lower short-term value.
That acceptance is what keeps the intraday environment structurally bearish despite localized buying.

Detection Matrix Module
The derivatives layer shows leverage steadily leaving the system.
This is not panic.
This is position reduction.
Detection Matrix
| Detection Metric | Reading / Live Observation |
|---|---|
| OI 24H Shift | -4.32% |
| OI 1H Change | -1.15% |
| Liquidation Alerts | 0 Blocks Flushed |
| BOS / CHOCH Status | No BOS / Neutral CHOCH |
| Composite Confidence | 74% Institutional Bearish Control |
A falling open interest profile means fewer active leveraged participants remain committed. That weakens expansion potential and supports rotational execution.
No BOS (Break of Structure) confirms that neither buyers nor sellers have broken control of the active range.
No CHOCH shift means there has been no internal character change.
That keeps the market mechanically neutral inside a bearish microstructure.
Liquidity Concentration Zones
| Liquidity Cluster | Price Level |
|---|---|
| Long Liquidation Zone | $61,748.70 |
| Short Liquidation Zone | $62,870.30 |
| Largest Cluster Concentration | $214,021 |
These liquidity zones matter because they define where trapped inventory exists.
But right now, neither side has been forced.
That’s why liquidations remain at zero.
The market has not reached pain yet.

Key Technical Observations
- Session POC remains centered at $62,400.00, confirming fair value acceptance.
- Bollinger Band Width remains compressed at 1.01%, reflecting restricted volatility conditions.
- Funding rate sits negative at -0.0042%, showing long-side leverage outflow.
- Basis spread remains slightly negative at -$6.36, showing weak futures premium appetite.
- Total OI capacity remains concentrated on Binance ($121,569), maintaining dominant exchange influence.
- No liquidity sweeps detected during this active session window.
- Footprint imbalance still favors sellers despite positive live CVD.
FAQ Section
What does trading below VWAP indicate?
It means the average session buyer is holding inventory at a loss, which often creates overhead supply.
Why is low relative volume important?
Low participation reduces breakout conviction and keeps price rotating.
What does volatility compression tell traders?
It reflects reduced price expansion and tighter execution boundaries.
Why does declining open interest matter?
It shows traders are reducing leverage rather than adding new conviction.
What does “No BOS” mean?
It means no side has broken the current structural range.
Technical Conclusion
Bitcoin’s current intraday structure remains defined by balance, compression, and reduced leverage participation. Spot buyers continue engaging the tape, but their efforts remain absorbed into passive sell-side liquidity while price stays below both VWAP and EMA20.
The footprint confirms seller efficiency.
The derivatives layer confirms leverage reduction.
The volume profile confirms fair value acceptance.
This is a market maintaining liquidity, not redistributing it aggressively.
Until that changes, the tape remains rotational by nature and structurally contained.
What was your cleanest 15-minute setup during this session?
Financial Disclaimer
This article is for educational and market commentary purposes only. It is not financial advice, investment guidance, or a trading recommendation. Always do your own research before making trading decisions.

