

Bitcoin continues to trade within a highly compressed structural environment, characterized by low-volatility consolidation and heavy rotational order flow rather than aggressive directional expansion. Live futures positioning reveals that liquidity is increasingly concentrated near local range boundaries, while active participation within the internal range continues to thin out. This distribution pattern suggests that market participants are absorbing liquidity at the extremes rather than driving immediate breakout momentum.
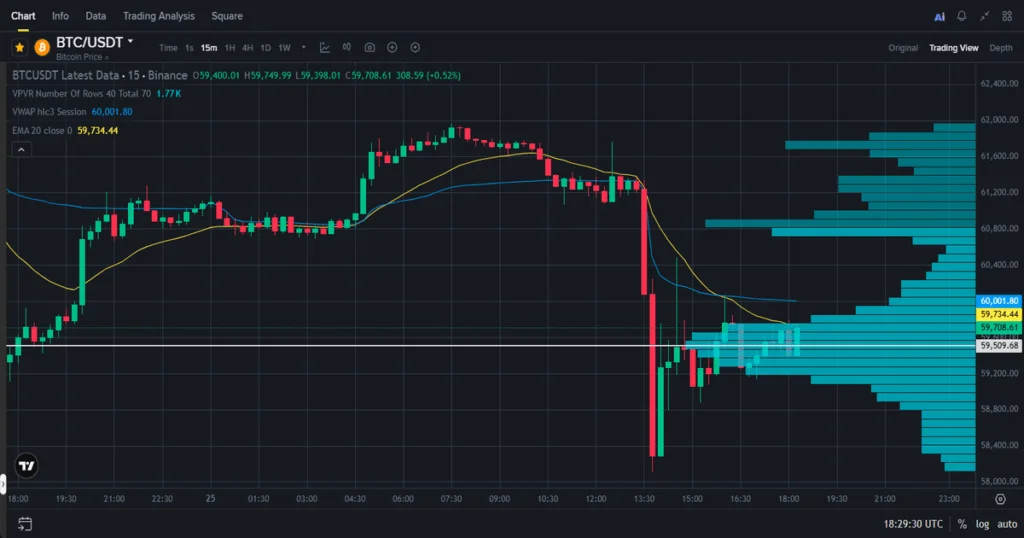
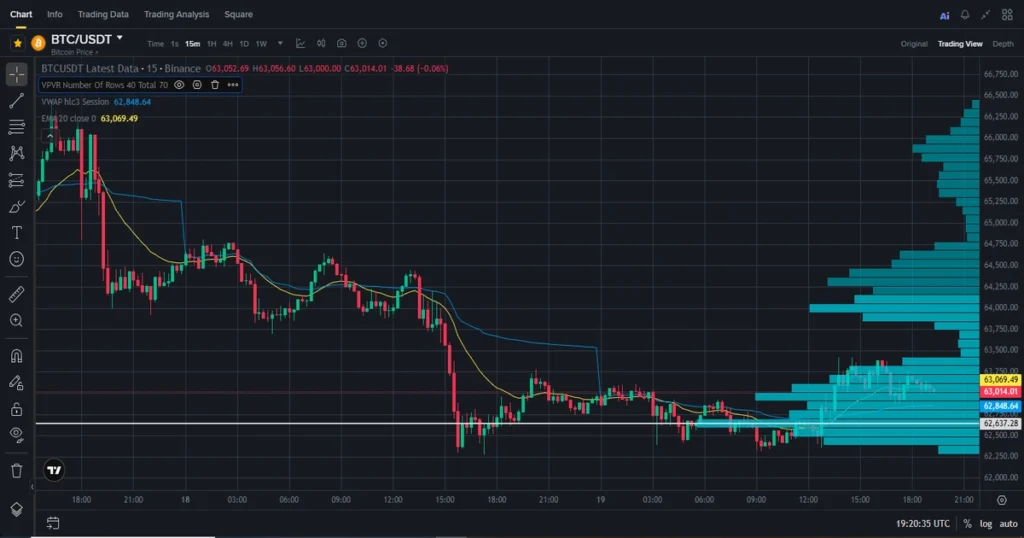
At the epicenter of the current session sits the Point of Control (POC) at $63,210.00, representing the absolute value equilibrium where the highest concentration of volume has been executed. With Bitcoin currently trading slightly lower at $63,014.00, the price action remains below this crucial high-volume node. This positioning shifts intraday control toward the sellers, indicating that the average market participant transacted at higher prices and is currently carrying negative inventory pressure.
From a broader technical perspective, the structural outlook remains defensive. Bitcoin is trading beneath both its 20-period Exponential Moving Average (EMA) and the session Volume Weighted Average Price (VWAP). Rather than lagging forecasting metrics, these dual institutional baselines serve as critical execution anchors for short-term positioning. Remaining below them reinforces immediate bearish resistance. In summary, the tape presents a classic compression phase: price is squeezing within tight liquidity pockets while open interest and leverage quietly flush out of the market.
Observed Runtime: Live UTC Feed
Market Snapshot Table
| Market Metric | Live Reading |
|---|---|
| Asset Pair | BTCUSDT |
| Current Price | $63,014.00 |
| 24H High | $63,581.10 |
| 24H Low | $62,446.90 |
| Trend Structure | Range Consolidation |
| EMA20 Position | Below EMA20 |
| VWAP Position | Below VWAP |
| Relative Volume | Weak |
| Liquidity Regime | Compression Rotation |
Active Structural Conditions
The current structural conditions remain highly balanced but internally tilted bearish.
| Execution Signal | Status / Order Flow Psychology |
|---|---|
| Below VWAP | Session inventory remains underwater |
| Below EMA20 | Sellers defend short-term momentum |
| Weak Participation | Thin environment reduces conviction |
Trading below VWAP changes the psychology of the entire order book.
VWAP represents the average price paid by all participants during the session. When price is under VWAP, the majority of executed buyers are sitting at a disadvantage. That often creates natural overhead supply because trapped participants become sellers when price rotates back toward their entry.
At the same time, being below EMA20 confirms short-term momentum remains weak. Momentum traders who use moving averages as active references are less likely to aggressively support price while this condition remains.
Intraday Boundary Check (At A Glance)
Bitcoin currently trades in the middle of a contained structural box.
The market sits approximately 567 points below the upper short-liquidation cluster at $63,581.10 and 567 points above the lower long-liquidation cluster at $62,446.90. This equalized distance tells us something important:
The market is balanced.
Neither side has forced aggressive displacement, and the active range remains mechanically intact.
Boundary Metrics
| Metric | Reading |
|---|---|
| Distance Below 24H High | 567.10 Points |
| Distance Above 24H Low | 567.10 Points |
| Value Area High (VAH) | $63,336.42 |
| Value Area Low (VAL) | $63,083.58 |
| Session POC | $63,210.00 |
Notice where current price sits.
Bitcoin is trading slightly below VAL ($63,083.58).
This matters because value area low often acts as a key reference where passive buyers attempt absorption. But current order flow shows that buying response remains weak.
The inability to quickly reclaim value suggests lower confidence participation rather than aggressive accumulation.
That creates a slow rotational tape.
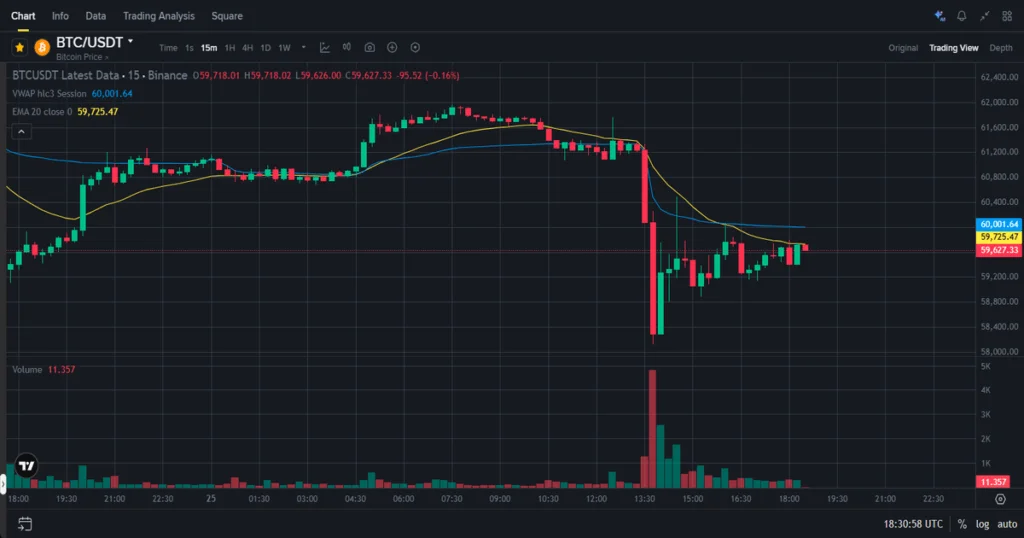
15-Min Live Execution & Trend Breakdown
The internal order flow shows clear evidence of passive buyers meeting stronger aggressive sellers.
Order Flow Dashboard
| Metric | Reading |
|---|---|
| Live CVD | 0.78 |
| Buyer Absorption | +17.64 BTC |
| Seller Aggression | -22.45 BTC |
| Net Footprint Delta | -4.81 BTC |
| OI+CVD Classification | Long Liquidation Escape Flow (Weak) |
The footprint matters here.
Buyers absorbed 17.64 BTC, which means passive bids were present. But sellers hit harder with 22.45 BTC of aggressive market selling.
This imbalance leaves a negative delta of -4.81 BTC.
That tells us buyers are defending, but they are losing.
The more important signal sits in the OI+CVD classification.
This is labeled Long Liquidation Escape Flow.
That means open interest is falling while price remains structurally weak. This combination often points to existing longs exiting positions rather than new short sellers entering.
That distinction matters.
A market driven by liquidation behaves differently from one driven by fresh aggressive positioning.
Here, the tape looks like cleanup—not expansion.
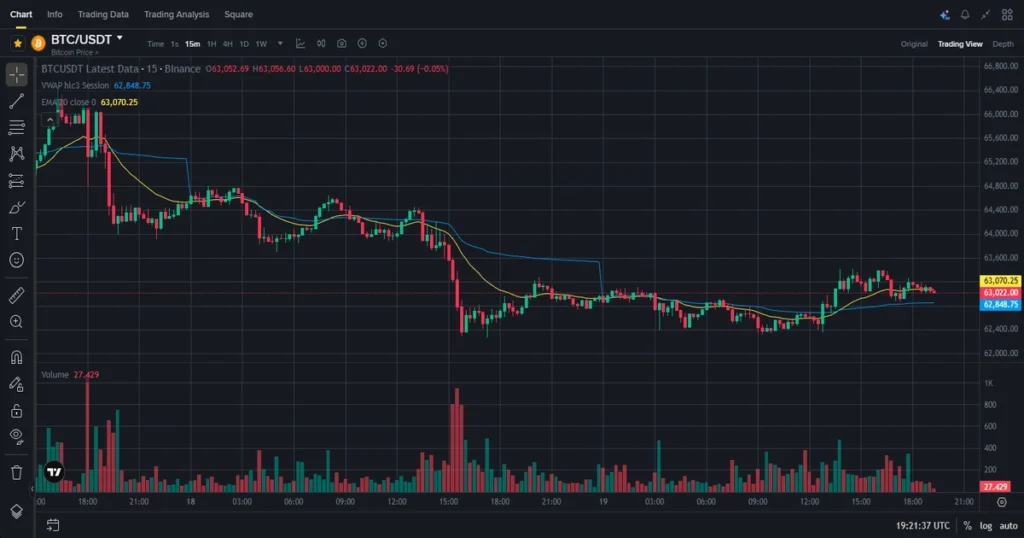
Institutional Gravity — EMA20 & VWAP Interaction
Institutional baselines remain overhead.
Structural Positioning
| Baseline | Current Status | Dynamic Market Control |
|---|---|---|
| EMA20 | Below | Momentum remains weak |
| VWAP | Below | Session buyers trapped |
This is where the market becomes psychologically heavy.
Trading below VWAP tells us average session participants are in negative territory. Those participants become reluctant holders.
When price attempts upward rotation, these trapped participants often sell into strength just to flatten exposure.
That creates natural supply.
The same applies to EMA20.
Price below EMA20 means the immediate trend remains defensive, and short-term momentum systems continue favoring protection over aggression.
This creates layered resistance behavior.
Not because resistance is magical—but because inventory is mispositioned.
Detection Matrix Module
The detection matrix remains structurally clean—no major anomalies, but clear leverage reduction.
Detection Matrix
| Detection Metric | Reading / Live Observation |
|---|---|
| OI 24H Shift | -4.32% |
| OI 1H Change | -1.15% |
| Liquidation Alerts | 0 Blocks Flushed |
| BOS / CHOCH Status | No BOS / Neutral CHOCH |
| Composite Confidence | 74% Institutional Bearish Control |
Open interest falling 4.32% over 24 hours is significant.
This shows capital leaving the derivatives market.
At the same time, the last hour shows another 1.15% reduction, confirming that the unwind is still active.
No liquidation blocks flushed.
No break of structure.
No displacement.
This is classic compression.
Liquidity Concentration Zones
| Liquidity Cluster | Price Level |
|---|---|
| Long Liquidation Zone | $62,446.90 |
| Short Liquidation Zone | $63,581.10 |
| Largest Cluster Concentration | $247,153 |
These zones matter because they represent concentrated leverage vulnerability.
When price approaches these zones, traders often react defensively—not because the levels are magical, but because exposure becomes fragile.
Liquidity attracts price.
That principle remains active.
Key Technical Observations
- Session POC remains centered at $63,210.00, keeping equilibrium overhead.
- Bollinger Band Width remains compressed at 0.79%, showing low volatility conditions.
- Funding remains slightly negative at -0.0042%, confirming light long-side pressure.
- Net basis spread remains almost flat at $0.01, showing no premium distortion.
- Total OI capacity across exchanges remains at $98,518.36.
- Binance dominates OI distribution with $41,377.71, representing the largest active leverage center.
- Bybit contributes $27,585.14, while OKX holds $17,733.30.
- CME institutional participation remains smaller at $11,822.20, showing lower traditional futures pressure.
- No liquidity sweeps were detected.
- No BOS confirms the active range remains structurally intact.
FAQ Section
What does trading below VWAP indicate?
It shows average session buyers are underwater, which often creates overhead supply.
Why is low relative volume important?
Because low volume reduces conviction and limits aggressive directional expansion.
What does volatility compression tell traders?
It shows price acceptance inside tighter ranges and lower immediate expansion behavior.
Why does declining open interest matter?
It reflects leverage leaving the market, often reducing aggressive trend continuation.
What does “No BOS” mean?
It means the current structure remains unbroken, keeping the active range valid.
Technical Conclusion
Bitcoin remains inside a compressed liquidity regime with declining open interest, weak buyer absorption, and structurally defensive positioning below both VWAP and EMA20.
The market continues rotating around active value without aggressive displacement.
Spot buyers are present but not dominant.
Sellers retain localized control, but leverage participation remains thin.
The absence of liquidation events, combined with neutral structure and low volatility, keeps this session mechanically rotational.
This is a market still balancing inventory.
That balance remains unfinished.
What was your best 15-minute setup today?
Financial Disclaimer
This article is for educational and market commentary purposes only. It is not financial advice, investment guidance, or a trading recommendation. Always do your own research before making trading decisions.

