

Bitcoin continues trading inside a highly rotational and compressed intraday environment, with price pinned tightly around the active value area and no confirmed directional expansion visible in the current execution window. The broader derivatives layer still holds elevated participation, but short-term positioning shows signs of localized contract reduction, signaling de-risking rather than aggressive new positioning.
From an institutional orderflow perspective, this is not a market currently expressing conviction. Instead, the tape reflects hesitation. Both buyers and sellers remain active, but neither side is forcing meaningful displacement. Price continues rotating around the session Point of Control (POC), a classic signature of balance.
The footprint layer confirms that seller aggression remains slightly dominant, though not with enough force to create structural failure. Buyers are still absorbing into weakness, but the absorption remains shallow and fragmented.
This keeps Bitcoin in what professional desks classify as a structural squeeze zone — a state where liquidity remains concentrated, volatility stays compressed, and orderflow becomes increasingly sensitive to imbalance.
Observed Runtime: 21 June 2026 | UTC
Market Snapshot Table
| Market Metric | Live Reading |
|---|---|
| Asset Pair | BTCUSDT |
| Current Price | $63,828.00 |
| 24H High | $64,496.67 |
| 24H Low | $63,050.67 |
| Trend Structure | Bearish Continuation (15m) |
| EMA20 Position | Below EMA20 |
| VWAP Position | Above VWAP |
| Relative Volume | Weak Participation |
| Liquidity Regime | Rotational Compression |
Active Structural Conditions
| Execution Signal | Status / Order Flow Psychology |
|---|---|
| Below EMA20 | Momentum remains short-term defensive |
| Above VWAP | Session buyers continue defending average cost |
| Weak Participation | Thin environment limiting aggressive expansion |
The split positioning between EMA20 and VWAP creates one of the most important structural conflicts in the current session. Momentum traders remain underwater below the short-term average, while session inventory holders still maintain localized control above VWAP.
That type of split often produces slower tape, heavier chop, and repeated rejection cycles near value.
Intraday Boundary Check (At A Glance)
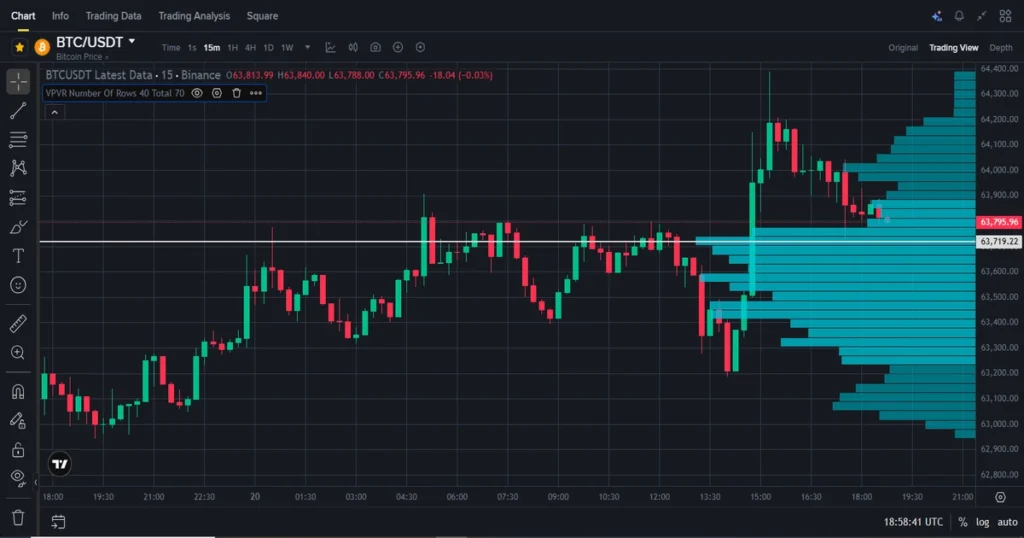
Bitcoin currently trades inside the lower-middle region of the session range, sitting approximately 668.67 points below the intraday high and 777.33 points above the session low.
This positioning tells us something important: the market is not stretched at either extreme. Instead, it remains centered inside active liquidity.
Boundary Metrics
| Metric | Reading |
|---|---|
| Distance Below 24H High | 668.67 Points |
| Distance Above 24H Low | 777.33 Points |
| Value Area High (VAH) | $64,077.80 |
| Value Area Low (VAL) | $63,822.00 |
| Session POC | $63,949.90 |
The current price sits almost directly at the lower boundary of value, with only $6 separating spot from VAL. This shows active compression.
When price stays this close to value lows without sharp rejection, it often reflects passive bid absorption rather than aggressive buying.
That distinction matters.
Passive absorption means participants are willing to transact but not yet force the market higher.
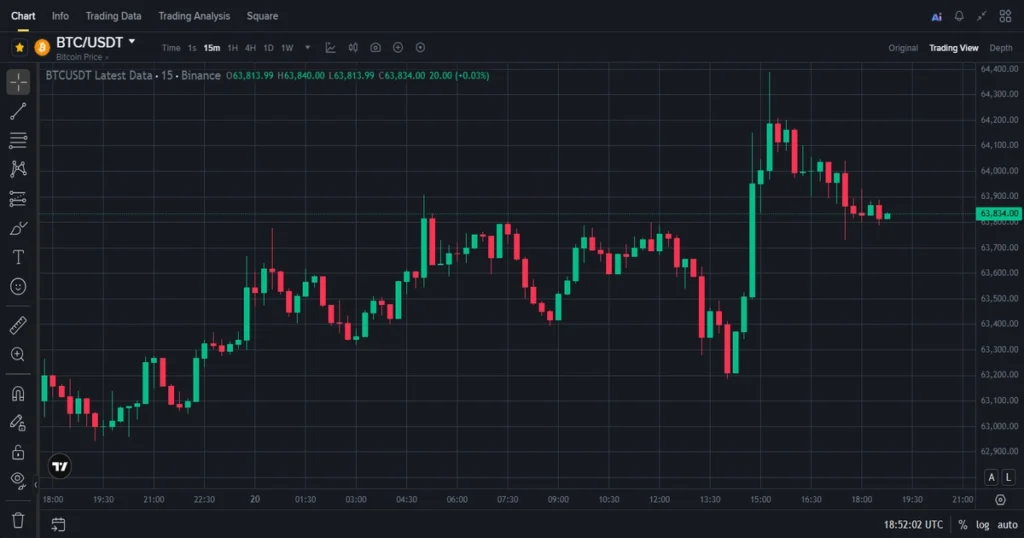
15-Min Live Execution & Trend Breakdown
The live footprint tells a very clean story.
Sellers remain slightly heavier than buyers.
Order Flow Dashboard
| Metric | Reading |
|---|---|
| Live CVD | -0.71 |
| Buyer Absorption | +0.95 BTC |
| Seller Aggression | -1.21 BTC |
| Net Footprint Delta | -0.26 BTC |
| OI+CVD Classification | Long Liquidation Escape Flow (Weak) |
Negative CVD means more aggressive sell-side execution is hitting the market. But the key here is magnitude.
A reading of -0.71 is bearish, but not extreme.
At the same time, buyer absorption of +0.95 BTC shows there is still passive liquidity willing to take those sells.
This creates what traders call a defensive absorption zone.
The seller aggression of -1.21 BTC remains stronger than buyer absorption, but the imbalance is narrow.
That narrow imbalance is why price remains compressed.
No major flush.
No aggressive lift.
Just rotation.
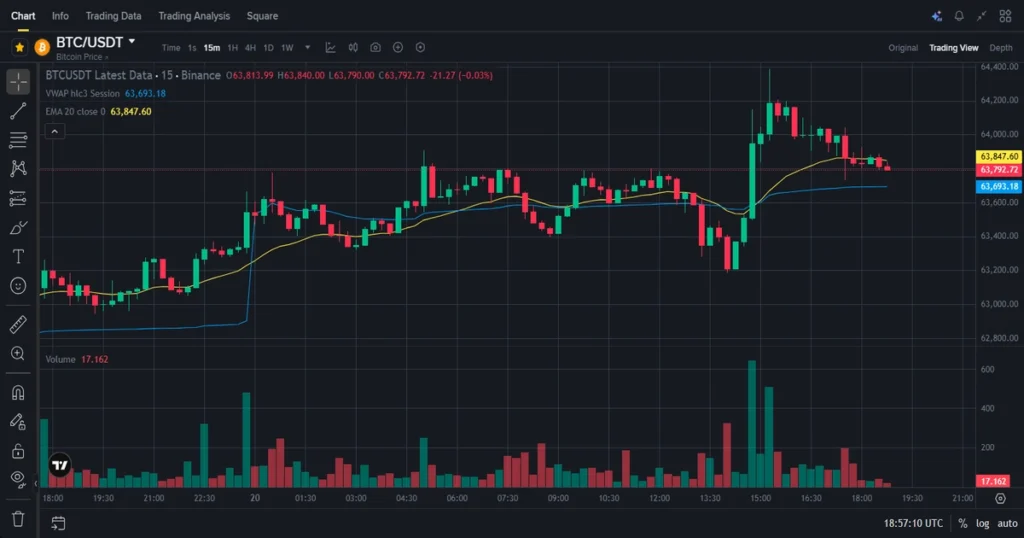
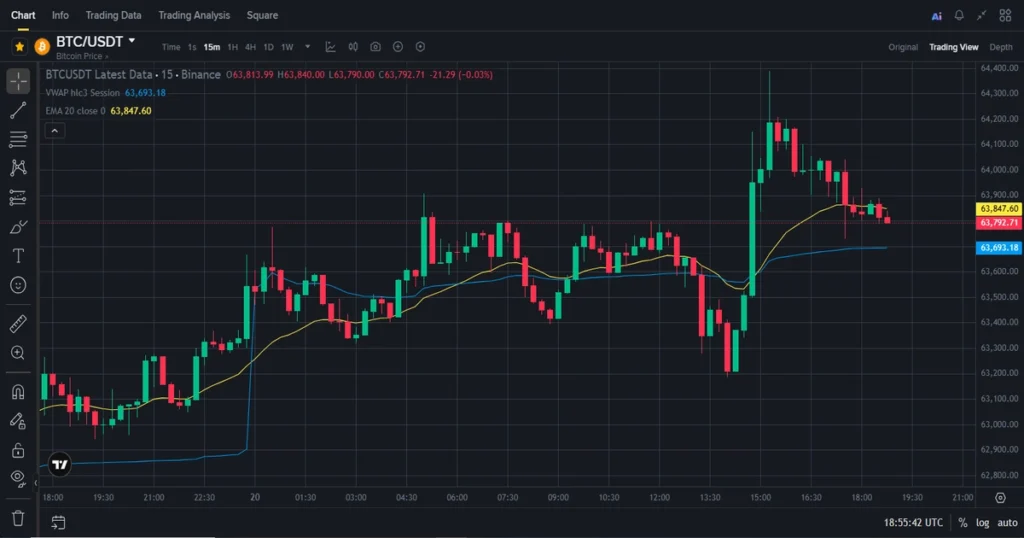
Institutional Gravity — EMA20 & VWAP Interaction
The relationship between price, EMA20, and VWAP remains one of the most important execution signals.
Bitcoin currently trades:
- Below EMA20
- Above VWAP
That’s an unusual split.
Structural Positioning
| Baseline | Current Status | Dynamic Market Control |
|---|---|---|
| EMA20 | Below | Momentum sellers maintain pressure |
| VWAP | Above | Session buyers retain inventory advantage |
Trading below EMA20 means short-term trend traders remain defensive.
Their average momentum entry sits above price, meaning many remain trapped.
Holding above VWAP means average session execution remains healthier.
VWAP acts as institutional fair value.
As long as price stays above it, average participants are not fully underwater.
That reduces panic.
This balance between trapped momentum traders and stable session holders explains why the tape remains slow.
Futures Analytics Layer
The derivatives structure remains highly active.
Funding sits positive.
Open interest remains elevated.
But short-term OI has declined.
Detection Matrix
| Detection Metric | Reading / Live Observation |
|---|---|
| OI 24H Shift | +8.76% |
| OI 1H Change | -1.15% |
| Funding Rate | +0.0087% |
| Liquidation Alerts | 0 Blocks Flushed |
| BOS / CHOCH Status | No BOS / Neutral CHOCH |
| Composite Confidence | 67% |
The 24-hour increase in OI confirms elevated positioning remains inside the system.
But the 1-hour decline tells us some contracts are being closed.
That combination often shows partial de-risking inside an otherwise active leveraged environment.
Funding staying positive means long-side capital remains dominant.
But the lack of liquidation blocks confirms no forced event is currently happening.
This is controlled positioning.
Not panic.
Liquidity Concentration Zones
Liquidity remains concentrated on both sides.
Liquidity Zones
| Liquidity Cluster | Price Level |
|---|---|
| Long Liquidation Zone | $63,253.50 |
| Short Liquidation Zone | $64,402.50 |
| Largest Cluster Concentration | $136,367 |
The short cluster sits close to the upper session boundary.
That keeps upside pressure capped.
The long cluster below remains the nearest support magnet.
This creates a clean liquidity sandwich.
Price remains trapped inside it.
Basis & Arbitrage Layer
Spot price currently sits at $63,829.65.
Futures mark price sits at $63,828.00.
That creates a negative basis of -$1.65.
Annualized basis yield sits at -0.03%.
This near-flat basis shows almost no meaningful premium between spot and futures.
That tells us leverage remains balanced.
There is no aggressive overpricing in the futures market.
This supports the broader neutral structure.
Key Technical Observations
- Session POC remains centered at $63,949.90.
- Bollinger Band Width remains compressed at 1.23%.
- Funding remains positive at +0.0087%.
- Spot-futures basis remains nearly flat at -0.03%.
- No liquidity sweeps detected.
- No BOS printed on the 15-minute structure.
- Composite confidence remains at 67%.
- OI remains elevated across Binance, Bybit, OKX, and CME.
FAQ Section
What does trading below VWAP indicate?
It shows average executed buyers are holding weaker inventory and sellers maintain short-term pressure.
Why is low relative volume important?
Low participation reduces conviction and keeps price rotating inside value.
What does volatility compression tell traders?
It shows the market is balanced and aggressive expansion remains absent.
Why does declining open interest matter?
It signals contracts are being closed, reducing active risk in the system.
What does “No BOS” mean?
It means no major swing structure has been broken.
Technical Conclusion
Bitcoin remains locked inside a highly compressed intraday orderflow environment where both spot and derivatives participants continue rotating around fair value.
Seller aggression remains active, but not dominant enough to create structural failure.
Buyers continue absorbing, but not with enough strength to create aggressive expansion.
The value area remains intact.
The footprint remains balanced.
Open interest remains elevated but slightly lighter on the short-term.
This is the kind of market professionals treat as a live auction still searching for imbalance.
Right now, that imbalance has not arrived.
What was your best 15-minute setup today?
Financial Disclaimer
This article is for educational and market commentary purposes only. It is not financial advice, investment guidance, or a trading recommendation. Always do your own research before making trading decisions.

