
Introduction
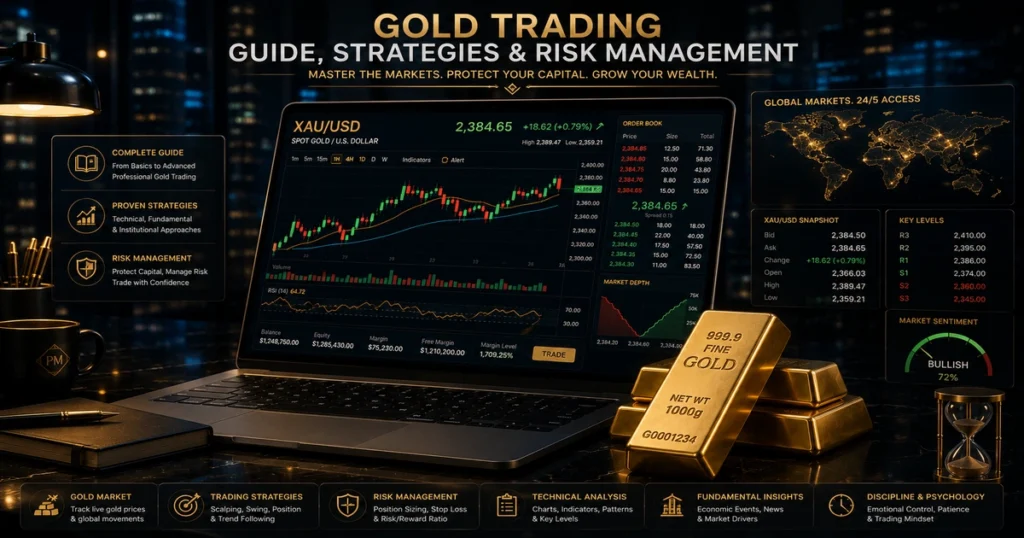
This Gold Trading Guide explains how professional traders analyze XAU/USD, manage risk, and build consistent trading strategies.
Gold (XAU/USD) is not like standard currencies or equities. It is an aggressive, high-volatility asset that moves with ruthless momentum.
A single high-impact economic announcement can move gold $30 in seconds, vaporizing unmanaged accounts before a trader can even click “Close Position.”
However, professional institutional traders view this volatility as pure opportunity. By treating gold trading as a business governed by probability, market mechanics, dynamic position sizing, and session liquidity, you can systematically capture high-reward market moves.
In this guide, you will learn the exact structural mechanics of XAU/USD, compare execution instruments, master high-probability technical setups, and implement institutional risk frameworks designed to keep your capital safe.
💡 In Simple Words: Think of gold trading like driving a high-performance sports car. If you don’t know how the brakes work (Stop-Loss) or how fast you’re going (Position Sizing), you will crash. But if you master the controls, it is one of the most liquid and rewarding markets in the world.
Gold Trade Snapshot
| Trading Parameter | Institutional Standard Specs |
| Primary Ticker Symbol | XAU/USD (Spot Gold / US Dollar) & GC (COMEX Gold Futures) |
| Market Structure | 24/5 Over-the-Counter (OTC) & Centralized Futures Exchanges |
| Primary Trading Sessions | London Session (08:00–16:00 GMT) & New York Session (13:00–21:00 GMT) |
| Average Daily Volatility | $15.00 – $35.00 USD Price Range per Troy Ounce |
| Common Instruments | Spot Forex (XAU/USD), Futures (COMEX/CME), Options, CFDs |
| Maximum Recommended Leverage | 1:10 for Retail Swing Traders; 1:2 to 1:5 for Risk-Managed Allocations |
| Primary Regulatory Bodies | CFTC / NFA (USA), FCA (UK), MAS (Singapore), ASIC (Australia) |
AI Overview & Quick Summary
Gold trading is the practice of speculating on short- to medium-term price movements of gold against fiat currencies (primarily USD) using derivative instruments like spot contracts, futures, or CFDs. Unlike long-term gold investing, active gold trading aims to profit from both rising and falling markets by utilizing technical analysis, macroeconomic triggers (interest rates, USD Index), and tight risk parameters.
Understanding the Gold Market Structure: Spot vs. Derivatives
Quick Answer: The gold market is structured into two main execution models: Over-the-Counter (OTC) Spot Markets (decentralized trading between brokers and banks traded 24/5) and Centralized Futures Exchanges (standardized contracts traded on exchanges like COMEX/CME Group with transparent order book volumes).
1. Spot Gold (XAU/USD)
Spot gold represents the immediate purchase or sale of physical gold, quoted in US Dollars per Troy Ounce (1 Troy Ounce = 31.1035 grams).
- Trading Model: Traded 24/5 across decentralized Over-the-Counter (OTC) forex networks.
- Pricing Standard: Real-time international spot price updates.
- Best Used For: Intraday swing trading and continuous market liquidity access.
2. Gold Futures Contracts (COMEX / CME Group)
Gold futures are standardized, exchange-traded contracts requiring the buyer to purchase (and seller to deliver) a set quantity of gold at a specified price on a future expiration date.
- Standard Contract (GC): 100 Troy Ounces per contract.
- E-mini Contract (QO): 50 Troy Ounces per contract.
- Micro Contract (MGC): 10 Troy Ounces per contract (Ideal for growing accounts).
- Key Advantage: Transparent central exchange volume data and CFTC regulatory oversight.
3. Contracts for Difference (CFDs) & Options
- Gold CFDs: Popular among retail traders outside the US. A CFD allows speculation on price differences without taking physical delivery. Features flexible position sizing (down to 0.01 micro-lots) but incurs overnight swap fees.
- Gold Options: Financial derivatives giving traders the right (not obligation) to buy (Call) or sell (Put) gold contracts at a set strike price. Ideal for hedging macro event risk with defined risk.
💡 In Simple Words:
- Spot (XAU/USD): Buying or selling gold instantly at today’s live rate via a forex broker.
- Futures (COMEX): Buying or selling a formal contract on a central exchange with a fixed future delivery date.
- CFD: Speculating on gold price movements using fractional contract sizes (micro-lots) without holding real metal.

⚡ Quick Recap: Market Structure
- ✔ Spot Gold (XAU/USD): 24/5 Over-the-Counter liquid trading.
- ✔ Futures (COMEX): Exchange-cleared, transparent volume, fixed expirations.
- ✔ CFDs: Fractional lot sizing (0.01), ideal for smaller accounts outside the US.
Primary Fundamental Drivers of Gold Prices
AI Overview Answer: Gold prices are primarily driven by three macroeconomic variables: the US Dollar Index (DXY) (inverse correlation), Real Interest Rates & Bond Yields (opportunity cost of holding non-yielding gold), and Geopolitical Risk/Central Bank Reserve Buying (safe-haven demand).
[Federal Reserve Interest Rate Cut Expectations] ──► [Real Yields Drop] ──► [Gold Price Rises (XAU/USD Up)]
[U.S. Dollar Index (DXY) Rallies Stronger]        ──► [Gold Becomes Expensive] ──► [Gold Price Falls (XAU/USD Down)]
Key Drivers Breakdown:
- The US Dollar Index (DXY) Inverse Relationship:
- Gold is priced globally in US Dollars.
- A strengthening US Dollar makes gold more expensive for foreign buyers (driving prices down).
- A weakening US Dollar boosts foreign purchasing power (driving gold prices up).
- Real Interest Rates & Bond Yields:
- Gold pays no annual dividend or interest yield.
- Real Yield is calculated as:$$\text{Real Yield} = \text{Nominal Treasury Yield} – \text{Inflation Rate}$$
- Rising Real Yields: Money moves from gold into interest-bearing US Treasuries (Gold falls).
- Falling/Negative Real Yields: Cash/Bonds lose purchasing power, driving capital into gold (Gold rises).
- Geopolitical Risk & Central Bank Reserves:
- Conflicts, sovereign debt stress, or inflation spikes drive institutional flight-to-safety into bullion.
- Central bank reserve allocations (tracked by the World Gold Council) establish multi-year price floors.
Pro Tip: Before opening any XAU/USD trade, check the US 10-Year Real Yield chart (Ticker:
US10Y–Inflation Expectation). If real yields are breaking out higher, avoid taking aggressive long trades on gold!
⚡ Quick Recap: Fundamental Drivers
- ✔ DXY Stronger: Gold Price Down | DXY Weaker: Gold Price Up.
- ✔ Real Yields Rise: Capital exits gold | Real Yields Fall: Capital flows to gold.
- ✔ Geopolitical Crises: Safe-haven demand boosts gold prices.
Key Technical Trading Strategies for Gold (XAU/USD)
Quick Answer: Technical gold trading relies on identifying price action structures during high-volume sessions. The three most proven strategies are the London-NY Session Overlap Breakout, Moving Average Crossover with RSI Confirmation, and the Support/Resistance Break-and-Retest Setup.
1. London-New York Session Overlap Breakout
The highest trading volume and price volatility occur when the London session and New York session overlap (13:00 to 16:00 GMT).
London / NY Overlap Session Timeline:
[ London Only Session (08:00 GMT) ] ──► Establishes Asian High/Low Range
                                                │
[ London/NY Overlap (13:00 - 16:00 GMT) ] ──► ⚡ Liquidity Surge & Breakout Triggered
- Setup: Mark the Asian session high and low price range (00:00 to 07:00 GMT).
- Trigger: Wait for the London/NY overlap (around US Economic Data releases at 13:30 GMT).
- Entry: Place a buy-stop order 5 pips above the Asian High or a sell-stop order 5 pips below the Asian Low upon a confirmed 15-minute candle close outside the range.
- Stop-Loss: Position the stop-loss back inside the middle of the Asian consolidation range.
Interactive Tool Placeholder:
[INSERT WIDGET: Live Session Clock & Volatility Heatmap]
2. Moving Average Crossover with RSI Filter (Swing Strategy)
This setup captures multi-day trend moves across 1-Hour (H1) and 4-Hour (H4) charts.
- Indicators Required: 20-Period Exponential Moving Average (EMA), 50-Period EMA, and 14-Period RSI.
- Bullish Signal (Long):
- 20 EMA crosses above 50 EMA.
- RSI is above 50 but below 70 (indicating healthy momentum without overbought risk).
- Price pulls back to retest the 20 EMA dynamic support line.
- Bearish Signal (Short):
- 20 EMA crosses below 50 EMA.
- RSI is below 50 but above 30.
- Price pulls back to retest the 20 EMA dynamic resistance line.
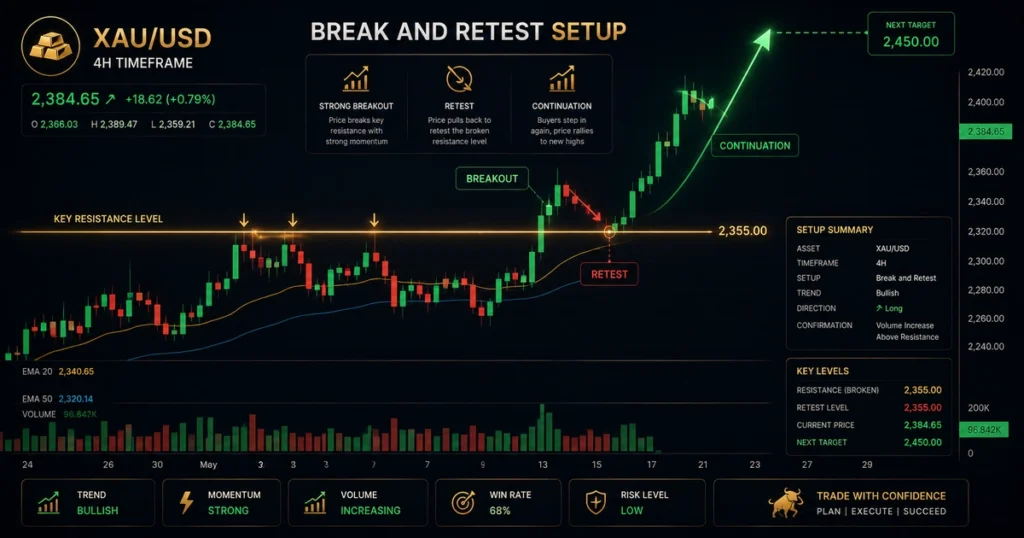
3. Key Support & Resistance Break-and-Retest
Gold frequently sweeps key daily support and resistance levels to clear liquidity before initiating sustained moves.
Break-and-Retest Setup:
Resistance Level: ───────────────────────┐
                                         │  (Breakout Candle)
                                ▲        ▼
                              ┌───┐    ┌───┐
                              │   │    │   │  ◄── Retest Confirms New Support
   ───────────────────────────┴───┴────┴───┴──────────────────────────────
- Identify Level: Mark key Daily (D1) and 4-Hour (H4) horizontal support and resistance levels.
- Observe Breakout: Wait for a strong breakout candle to close fully beyond the horizontal level.
- Wait for Retest: Do NOT chase the breakout candle. Wait for price to pull back and retest the broken level.
- Confirm Entry: Enter in the direction of the breakout upon observing a candlestick rejection pattern (Pin Bar or Engulfing Candle) on the retest.
⚡ Quick Recap: Technical Strategies
- ✔ Session Overlap: Trade breakouts during 13:00–16:00 GMT for peak volume.
- ✔ MA Crossover: Combine 20/50 EMA cross with RSI (50–70) for trend confirmation.
- ✔ Break & Retest: Never chase breakout candles; enter only on retest rejections.
Gold Trading Instruments Comparison Matrix
Selecting the proper instrument depends on your account capitalization, location, and strategy duration:
| Feature / Metric | Spot Gold (XAU/USD) | Gold Futures (COMEX: GC) | Gold CFDs | Gold Options |
| Primary Execution Venue | OTC / Forex Brokers | Centralized Futures Exchange | Retail CFD Brokers | Exchanges (CME) / OTC |
| Regulator | FCA, ASIC, MAS | CFTC, NFA | FCA, ASIC, CySEC (No US Users) | CFTC, SEC |
| Contract Size | 100 oz (Standard Lot) | 100 oz (Full), 10 oz (Micro) | Variable (from 0.01 lots) | 100 oz per Contract |
| Pricing Transparency | Broker Aggregated | Public Central Limit Order Book | Broker Quote Spread | Black-Scholes Volatility Model |
| Overnight Fees (Swap) | Yes (Pips based) | None (Futures Rollover) | Yes (Daily Swap) | None (Options Premium) |
| Leverage Available | Up to 1:30 (EU/UK) / 1:500 (Offshore) | ~1:15 (Margin based) | Up to 1:30 | Fixed Premium Risk |
| Best Used For | Intraday & Scalping | Institutional & Professional | Small Account Growth | Hedging Macro Events |
Risk Management & Position Sizing Framework
Quick Answer: Risk management in gold trading requires strictly enforcing the 1% Risk Rule—never risking more than 1% of total account equity on a single trade. Position size must be calculated dynamically based on stop-loss distance in pips and lot contract size.
⚠️ Warning Box: Never trade gold without a hard Stop-Loss order hardcoded on your broker’s server. Slippage during high-impact news events (such as Non-Farm Payrolls or FOMC rate decisions) can liquidate unmanaged accounts in seconds.
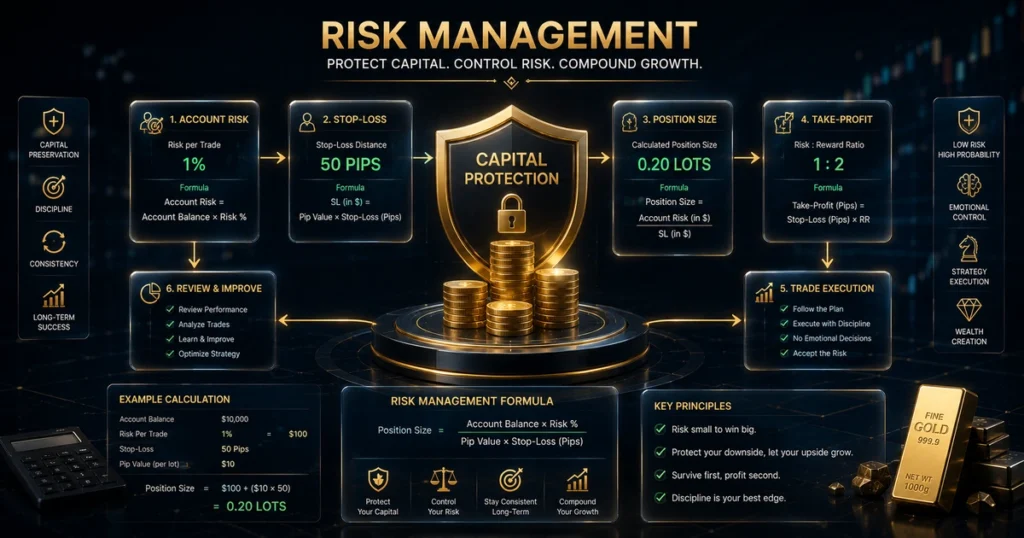
The 1% Risk Rule Formula
Never risk more than 1% to 2% of your total account equity on a single trade setup.
$$\text{Position Size (Lots)} = \frac{\text{Account Equity} \times \text{Risk Percent}}{\text{Stop-Loss (Pips)} \times \text{Pip Value}}$$
Step-by-Step Example Calculation:
- Account Equity: $10,000 USD
- Risk Limit (1%): $100 USD
- Stop-Loss Distance: 50 Pips ($5.00 price move on XAU/USD)
- Pip Value (Standard Lot): $10 per pip
- Calculated Position Size:$$\text{Lots} = \frac{\$100}{50 \times \$10} = 0.20 \text{ Lots (2 Mini Lots)}$$
⚡ Quick Recap: Risk Rules
- ✔ Maximum Risk: Cap risk at 1% of equity per trade setup.
- ✔ Hard Stop-Loss: Always hardcode server-side stop-loss orders.
- ✔ Dynamic Position Sizing: Adjust lot size based on pip distance, not fixed lots.
4 Critical Mistakes That Destroy Gold Accounts
Avoid these four systematic mistakes that consistently wipe out retail gold traders:
- Over-Leveraging on Small Accounts: Trading 1.0 standard lot ($100,000 contract value) on a $1,000 account leaves zero margin safety. A minor $10 price pullback in gold wipes out the account.
- Trading During Off-Peak Hours: Trading gold during late Asian hours (when volume is low) often leads to choppy, unpredictable price action with widened broker spreads.
- Holding Open Positions Through Tier-1 News: Trades held through FOMC Rate Statements, CPI Inflation Releases, or NFP Data expose traders to catastrophic spread expansion and slippage.
- Counter-Trend Scaling (Averaging Down): Adding to a losing short position while gold is in a strong macro bull trend is the single fastest way to trigger a margin call.
🎓 Expert Note: “The goal of a successful gold trader is not to make a fortune on one trade. It is to protect equity during choppy regimes so you are fully capitalized when clean trend breakouts emerge.” — CurrencyPlans Derivatives Desk
Step-by-Step Guide: Gold Trading Guide for Beginners
Quick Answer: To trade gold safely: 1) Open an account with a tier-1 regulated broker, 2) Practice execution on a demo account for 30+ days, 3) Build a written plan with a 1% risk limit, and 4) Start real trading with 0.01 micro-lots.
Step 1: Select Regulated Broker ──► Step 2: Choose Platform (MT5/cTrader) ──► Step 3: Paper Trade Strategy
                                                                                     │
Step 4: Execute Small Real Positions ◄── Step 5: Master Risk Management ◄─────────────┘
Actionable Setup Roadmap:
- Select a Strictly Regulated Broker:
- Verify oversight under CFTC/NFA (US), FCA (UK), ASIC (Australia), or MAS (Singapore).
- Ensure broker provides negative balance protection.
- Choose Your Execution Platform:
- Select platforms providing low-latency execution and real-time technical charting (MetaTrader 5, cTrader, TradingView).
- Practice on a Demo Account:
- Paper trade your strategy for at least 30 to 60 days to verify win rates and execution consistency before committing real capital.
- Formulate a Written Trading Plan:
- Establish explicit entry rules, exit triggers, 1% risk rules, and daily stop-loss limits (e.g., stop trading after 2 consecutive losses).
- Fund & Scale Incrementally:
- Begin real live trading using 0.01 micro-lots to build emotional discipline before scaling lot sizing up.
⚡ Quick Recap: Execution Checklist
- ✔ Regulated Broker: Tier-1 jurisdiction oversight (FCA/CFTC/ASIC).
- ✔ Demo Validation: 30+ days paper trading proof of strategy.
- ✔ Start Small: 0.01 micro-lots before scaling real capital.
Internal Linking & Related Cluster Articles
Continue building your technical and macroeconomic foundation across the CurrencyPlans Precious Metals Cluster:
- Foundation Guide: Read our flagship master overview on Digital Gold Explained: How Global Vaulted Gold Works, Benefits, Risks, and Taxes.
- Taxation Strategy: Review our cross-border tax analysis on Global Gold Taxation: IRS, HMRC, and VAT Rules Explained.
- Asset Allocation: Compare long-term strategies in Gold ETFs vs. Physical Bullion: Which Asset Suits Your Portfolio?.
- Market Analysis: Read our deep dive on How the US Dollar Index (DXY) Drives Commodity Prices.
Frequently Asked Questions (FAQs)
Q1. Is gold trading suitable for absolute beginners?
Ans: Gold trading is challenging for absolute beginners due to high intraday volatility and dynamic fundamental drivers. Beginners should start with demo accounts, trade small micro-lots (0.01), and strictly avoid high leverage until consistency is established.
Q2. What is the best time of day to trade XAU/USD?
Ans: The optimal window is during the London and New York Session Overlap (13:00 to 16:00 GMT). This period experiences peak liquidity, tightest broker spreads, and clearest technical breakout moves driven by economic data releases.
Q3. What is the difference between XAU/USD and Gold Futures (GC)?
Ans: XAU/USD is an Over-the-Counter (OTC) spot currency pair traded continuously with variable broker quotes and daily swap fees. Gold Futures (GC) are centralized contracts traded on exchanges like COMEX with fixed contract expiration dates, transparent exchange order books, and no overnight swap charges.
Q4. How much capital do I need to start trading gold?
Ans: While many retail CFD brokers allow opening accounts with $50, an institutional risk-managed starting balance of $1,000 to $5,000 USD is recommended to trade micro-lots (0.01) comfortably within 1% risk rules.
Conclusion & Strategic Verdict
Mastering gold trading requires a balance of macroeconomic analysis, disciplined technical execution, and rigorous risk management. By understanding how real yields, session liquidity, and the US Dollar impact price movements, traders can structure high-probability market entries while protecting equity against gold’s inherent volatility.
Recommended Action Plan:
- Develop Discipline: Test your technical strategy (Breakout or Mean-Reversion) on a demo platform for 30 days.
- Strict Risk Rules: Never risk more than 1% per trade and enforce mandatory stop-loss placement on every XAU/USD order.
- Combine Tools: Use futures order-flow or technical charts alongside real-time economic calendars to avoid news slippage.
Editorial Board & Trust Signals
- Written By: Senior Technical Market Analyst & Derivatives Strategist (CurrencyPlans Research Team)
- Reviewed By: Certified Financial Technician (CFT®) & Chartered Financial Analyst (CFA®) Board
- Fact-Checked Date: July 2026
- Sources Last Verified: July 2026
- Editorial Policy: All technical analysis models, contract specs, and regulatory guidelines are independently cross-referenced with CME Group, CFTC, and LBMA official publications.
Official References & Citations
- CME Group (COMEX): Gold Futures (GC) Contract Specifications
- U.S. Commodity Futures Trading Commission (CFTC): Leveraged Commodity Trading & Risk Disclosures
- London Bullion Market Association (LBMA): Precious Metals Market Structure & OTC Standards
- Federal Reserve Bank of St. Louis (FRED): 10-Year Treasury Real Consumer Price Index Data
Regulatory Disclaimer
Disclaimer: Gold trading and derivative speculation (CFDs, Futures, Options) carry a high level of risk to your capital and may not be suitable for all investors. High leverage can work against you as well as for you. Before trading, ensure you fully understand the risks involved, consider your investment objectives, and seek independent financial advice where necessary. CurrencyPlans does not provide financial or execution advice.

