

Bitcoin remains trapped inside a tightly compressed liquidity regime, with current execution behavior showing a classic rotational auction rather than directional expansion. The last 24-hour structure reflects balanced aggression between buyers and sellers, but beneath the surface, order flow is revealing a more complex internal battle.
At the time of observation, BTCUSDT trades at $64,178.00, sitting almost perfectly in the center of its broader liquidity boundaries. This kind of equilibrium rarely reflects directional conviction. Instead, it often signals inventory redistribution, passive absorption, and leveraged positioning without immediate resolution.
What makes this current environment interesting is the conflict between price structure and footprint behavior. Price remains above both EMA20 and VWAP, which normally supports intraday bullish stability. But deeper order flow metrics show new short positions entering while seller aggression remains stronger than buyer absorption.
That imbalance creates a dense execution environment where price appears stable on the surface while positioning underneath becomes increasingly active.
Observed Runtime: 21 June 2026 | UTC
Market Snapshot Table
| Market Metric | Live Reading |
|---|---|
| Asset Pair | BTCUSDT |
| Current Price | $64,178.00 |
| 24H High | $64,755.60 |
| 24H Low | $63,600.40 |
| Trend Structure | Range Consolidation |
| EMA20 Position | Above EMA20 |
| VWAP Position | Above VWAP |
| Relative Volume | Neutral Participation |
| Liquidity Regime | Compression / Rotational |
Active Structural Conditions
Current market structure remains structurally neutral, but the tape itself tells a more nuanced story.
| Execution Signal | Status / Order Flow Psychology |
|---|---|
| Above VWAP | Session buyers remain profitable |
| Above EMA20 | Intraday momentum remains structurally stable |
| Compressed Volatility | Participants are waiting for expansion |
Trading above VWAP means the average participant who bought this session remains in profit. That naturally creates defensive support behavior because those traders are less likely to panic out.
At the same time, price holding above EMA20 tells us short-term momentum hasn’t broken down. But momentum alone doesn’t control the market—liquidity does.
And right now, liquidity remains compressed.
Intraday Boundary Check (At A Glance)
Bitcoin currently sits almost exactly in the middle of its active 24-hour trading boundaries. This reflects balanced price discovery.
Boundary Metrics
| Metric | Reading |
|---|---|
| Distance Below 24H High | 577.60 Points |
| Distance Above 24H Low | 577.60 Points |
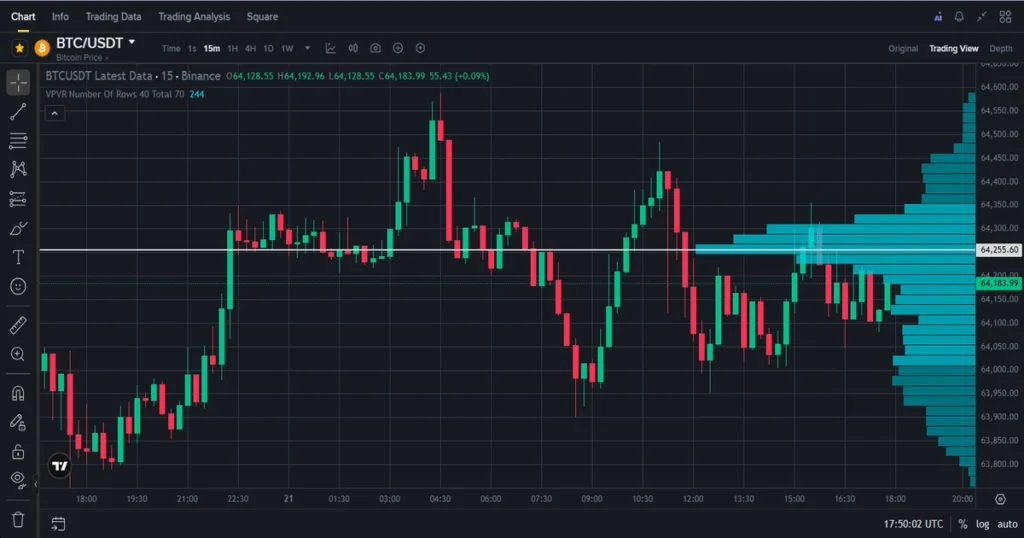
| Value Area High (VAH) | $64,184.11 |
| Value Area Low (VAL) | $63,927.89 |
| Session POC | $64,056.00 |
This mid-range location matters.
When price is centered like this, neither buyers nor sellers have successfully forced acceptance outside fair value.
The Session Point of Control (POC) at $64,056.00 acts as the most heavily traded price inside this session. That means this zone has attracted the most agreement between participants.
Price currently trades just above that.
That tells us the market is still accepting value here.
But notice how tight the Value Area remains:
- VAH = $64,184.11
- VAL = $63,927.89
That’s a narrow range of just 256.22 points, confirming compressed execution.
This type of narrow value area often creates hesitation.
Buyers hesitate near VAH because they risk paying premium prices.
Sellers hesitate near VAL because they risk selling discount inventory.
That’s why rotational markets feel slow.
Not because there’s no activity—but because both sides are absorbing each other.
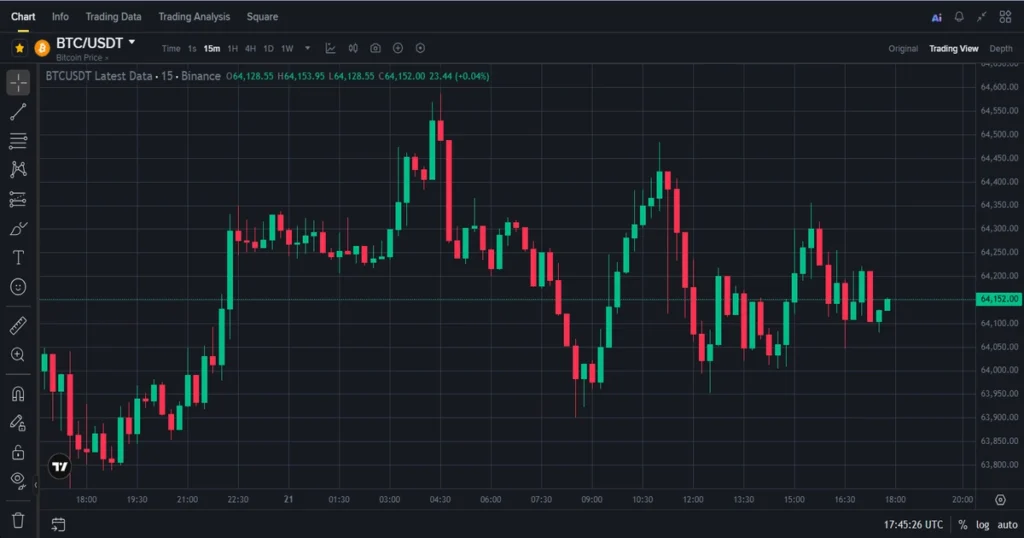
15-Min Live Execution & Trend Breakdown
The live order flow layer gives the clearest insight into current participant behavior.
Order Flow Dashboard
| Metric | Reading |
|---|---|
| Live CVD | -1.34 |
| Buyer Absorption | +17.32 BTC |
| Seller Aggression | -22.04 BTC |
| Net Footprint Delta | -4.72 BTC |
| OI+CVD Classification | New Short Positions Injected |
This is where things get interesting.
CVD (Cumulative Volume Delta) is negative, which means aggressive sell orders are dominating executed market volume.
But price isn’t collapsing.
That’s important.
This usually means passive buyers are absorbing those sell orders.
The footprint confirms this:
Buyers absorbed 17.32 BTC
Sellers attacked with 22.04 BTC
Net delta ended at -4.72 BTC
That tells us sellers are more aggressive, but not necessarily more effective.
Execution is being absorbed.
This is often where institutions quietly operate.
They allow aggressive participants to push into their resting liquidity.
Not because they’re weak—but because they want inventory.
The OI + CVD classification confirms this environment:
New Short Positions Injected
This means the negative delta isn’t just long liquidation.
It’s fresh short positioning.
That’s a completely different structural behavior.
Fresh shorts increase market tension.
Because every new short is potential future buy-side fuel.
But until forced out, they remain active supply.
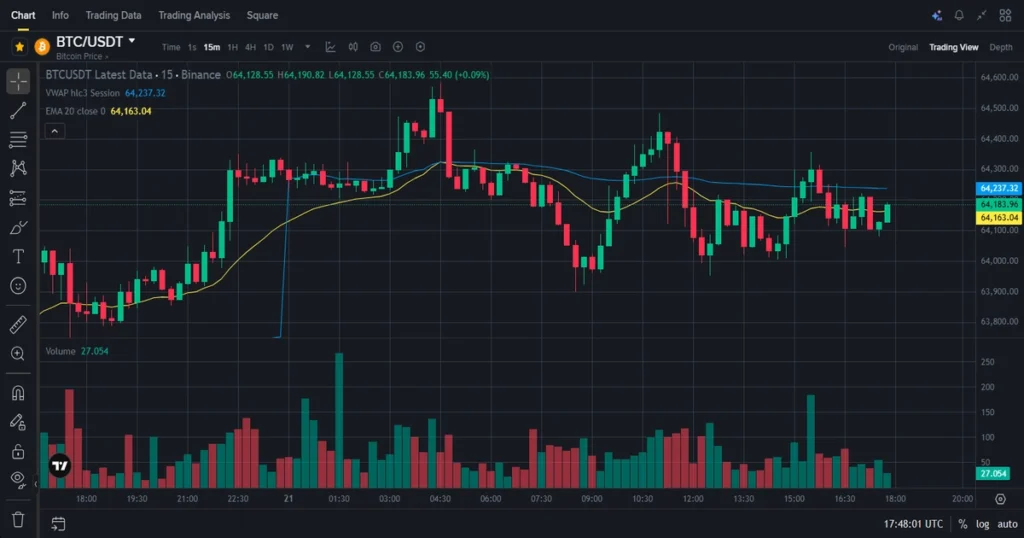
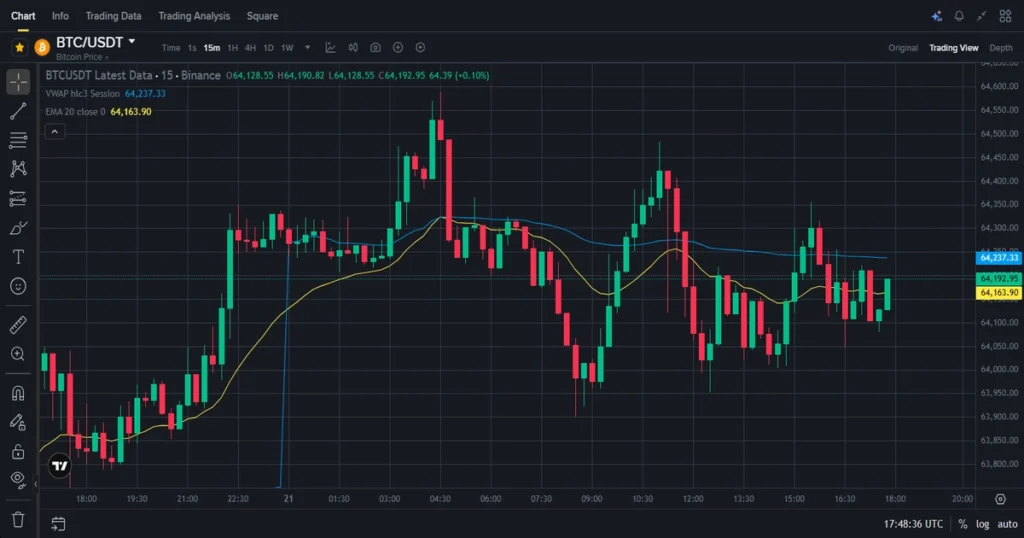
Institutional Gravity — EMA20 & VWAP Interaction
Bitcoin currently trades above both of the most important short-term institutional baselines.
Structural Positioning
| Baseline | Current Status | Dynamic Market Control |
|---|---|---|
| EMA20 | Above | Momentum remains structurally intact |
| VWAP | Above | Session buyers retain cost advantage |
This matters because institutions monitor VWAP aggressively.
VWAP represents average executed price.
When price remains above VWAP:
- Buyers remain in profit
- Sellers remain under pressure
- Passive bids often become more aggressive
That changes order book behavior.
Instead of deep pullbacks, markets often rotate sideways.
That’s exactly what we’re seeing.
Price isn’t rejecting VWAP.
It’s sitting above it.
That’s a sign of balance—not weakness.
EMA20 reinforces that same story.
Momentum remains supportive.
But order flow remains conflicted.
That’s why this market feels trapped.
Strong enough to avoid breakdown.
Weak enough to avoid expansion.
That’s compression.
Detection Matrix Module
The derivatives layer confirms positioning is increasing.
Detection Matrix
| Detection Metric | Reading / Live Observation |
|---|---|
| OI 24H Shift | +8.76% |
| OI 1H Change | +2.41% |
| Liquidation Alerts | 0 Blocks Flushed |
| BOS / CHOCH Status | No BOS / Neutral CHOCH |
| Composite Confidence | 59% |
Rising open interest without liquidation events tells us one thing:
Participants are building positions voluntarily.
Nobody is being forced out.
That means this market remains clean.
No panic.
No flushes.
No structural break.
The absence of Break of Structure (BOS) confirms range conditions remain intact.
CHOCH remains neutral.
That means no reversal event has occurred either.
Structure is frozen.
Only positioning changes underneath.
Liquidity Concentration Zones
| Liquidity Cluster | Price Level |
|---|---|
| Long Liquidation Zone | $63,600.40 |
| Short Liquidation Zone | $64,755.60 |
| Largest Cluster Concentration | $127,579 |
These zones act like magnets.
Markets naturally move toward trapped liquidity.
Right now price remains directly between them.
That’s why volatility remains low.
No side has triggered enough forced execution yet.
Key Technical Observations
- Session POC remains stable at $64,056.00
- Bollinger Band Width remains compressed at 0.44%
- Active volatility range equals $113.26
- Funding remains positive at +0.0087%
- Open interest expanded +8.76% in 24H
- Net basis spread remains flat at -$0.01
- No liquidation blocks triggered
- No liquidity sweeps observed
- Net Footprint Delta remains negative at -4.72 BTC
- Composite confidence remains balanced at 59%
FAQ Section
What does trading above VWAP indicate?
It shows average session buyers remain profitable, which usually supports stronger passive bids.
Why is compressed volatility important?
Compressed volatility often reflects reduced directional conviction and increased rotational behavior.
Why does rising open interest matter?
It confirms new positions are entering rather than existing ones simply exiting.
What does negative CVD mean?
It means aggressive sellers are hitting the market harder than buyers.
Why is no BOS important?
Because it confirms the market remains inside its established structural range.
Technical Conclusion
Bitcoin’s current structure reflects a balanced but tense market environment.
Price remains stable above VWAP and EMA20, showing short-term structural support. But beneath that stability, fresh shorts continue entering while seller aggression remains elevated.
That internal conflict creates a compressed execution environment.
No side controls the tape fully.
No structural break has occurred.
No forced liquidation has entered the market.
The auction remains intact.
And for now, Bitcoin continues behaving like a market in inventory transfer rather than directional discovery.
What was your best 15-minute setup today?
Financial Disclaimer
This article is for educational and market commentary purposes only. It is not financial advice, investment guidance, or a trading recommendation. Always do your own research before making trading decisions.

