

Bitcoin’s intraday tape is currently reflecting a compressed and rotational market environment, where liquidity remains concentrated inside a tight execution range and aggressive directional conviction remains absent. The current session structure shows price operating near the lower end of its immediate value area, while sellers continue maintaining localized control through both baseline positioning and derivatives pressure.
At the time of observation, BTCUSDT is trading at $62,676.31, sitting just under both VWAP and the 20-period exponential moving average, signaling that average session participants remain structurally underwater. This matters because when price holds below both institutional baselines, market behavior tends to shift from expansion into inventory defense.
What stands out most in this session is not aggressive selling itself—but the quality of selling. Open interest is declining, funding remains negative, and no major liquidation blocks have been flushed. That combination tells a very specific story: leverage is being reduced, but without panic.
This is not a fast tape. This is a measured tape.
Observed Runtime: Current UTC Session
Market Snapshot Table
| Market Metric | Live Reading |
|---|---|
| Asset Pair | BTCUSDT |
| Current Price | $62,676.31 |
| Trend Structure | Bearish Continuation (15M) |
| EMA20 Position | Below EMA20 |
| VWAP Position | Below VWAP |
| Relative Volume | Weak Participation |
| Liquidity Regime | Rotational Compression |
Active Structural Conditions
| Execution Signal | Status / Order Flow Psychology |
|---|---|
| Below VWAP | Sellers retain average session control |
| Below EMA20 | Momentum remains structurally defensive |
| Low Participation | Lack of initiative from both sides |
Intraday Boundary Check (At A Glance)
Bitcoin is currently positioned inside one of the tightest lower-bound execution zones of this session.
The market is sitting only $15.88 above the Value Area Low (VAL) while remaining $235.26 below the Value Area High (VAH). This asymmetry matters because it shows the market has spent more time accepting lower prices than auctioning upward.
Boundary Metrics
| Metric | Reading |
|---|---|
| Distance Below Session High | 235.26 Points |
| Distance Above Session Low | 15.88 Points |
| Value Area High (VAH) | $62,911.57 |
| Value Area Low (VAL) | $62,660.43 |
| Session POC | $62,786.00 |
The Point of Control (POC) remains centered above current price, which means most executed volume during this session occurred at higher levels.
That creates a psychological imbalance.
Participants who bought near fair value are now underwater, while participants who sold higher remain comfortable. This changes the way liquidity behaves. Instead of aggressive buying, what often emerges here is passive absorption—small bids stepping in, but without urgency.
That’s exactly what the tape is showing.
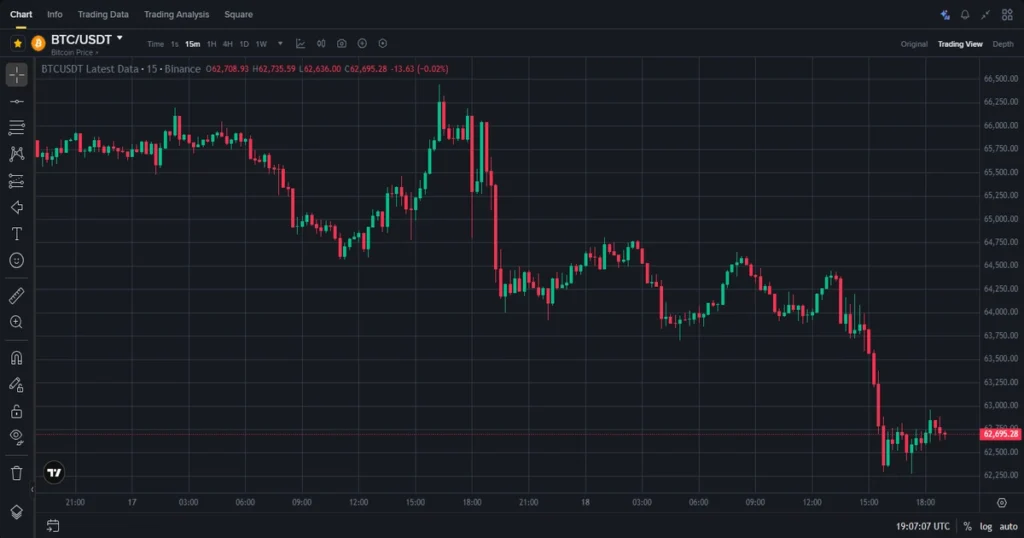
15-Min Live Execution & Trend Breakdown
The most important live order flow signal in this session is the divergence between spot absorption and futures aggression.
Spot buyers are absorbing approximately +27.12 BTC, but sellers are hitting the market with -34.51 BTC of active aggression.
That leaves the net footprint delta negative.
Order Flow Dashboard
| Metric | Reading |
|---|---|
| Live CVD | 0.75 |
| Buyer Absorption | +27.12 BTC |
| Seller Aggression | -34.51 BTC |
| Net Footprint Delta | -7.40 BTC |
| OI+CVD Classification | Long Liquidation Escape Flow (Weak) |
This tells us something important.
Buyers are present, but they are reactive—not proactive.
They are absorbing offers, but not lifting the book aggressively enough to reclaim value. Meanwhile, sellers continue pressing bids.
The result is a slow downward rotational environment rather than an impulsive breakdown.
The Live CVD at 0.75 confirms localized positive transaction flow, but because price is still below VWAP and footprint delta remains negative, that CVD strength lacks structural authority.
This is classic weak absorption behavior.
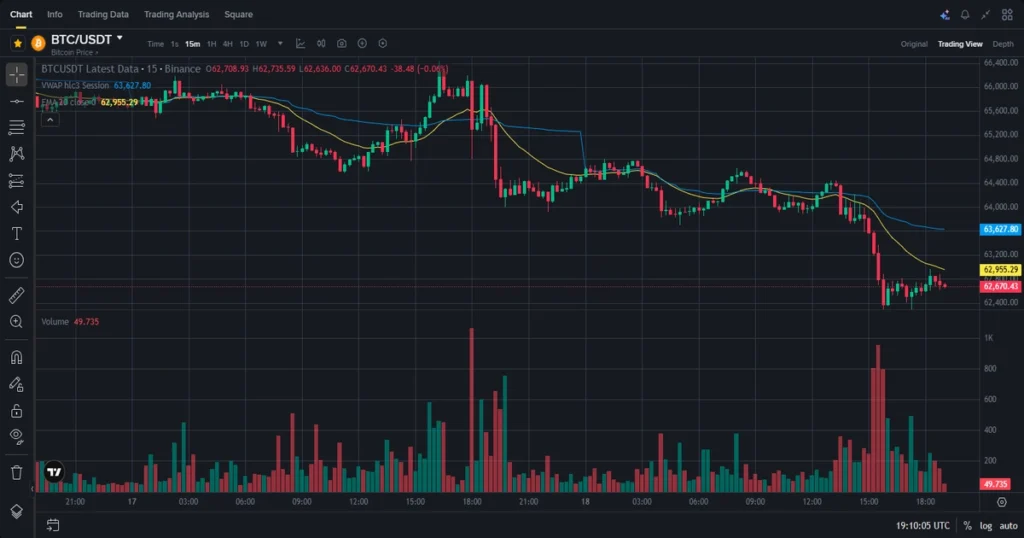
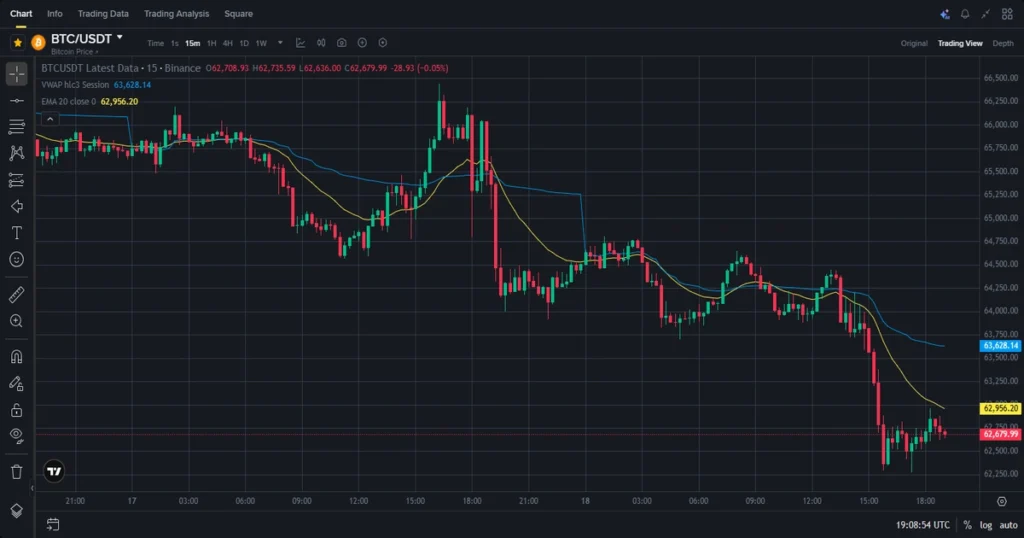
Institutional Gravity — EMA20 & VWAP Interaction
Bitcoin remains below both major intraday control baselines.
That matters more than many traders realize.
Structural Positioning
| Baseline | Current Status | Dynamic Market Control |
|---|---|---|
| EMA20 | Below | Short-term momentum remains defensive |
| VWAP | Below | Session average remains seller-controlled |
VWAP represents the average price paid by participants throughout the session.
When price trades below VWAP, it means average buyers are underwater.
That changes behavior.
Instead of bidding aggressively, many participants begin using rallies to reduce risk or exit positions. That often creates overhead friction.
The same applies to EMA20.
Being below EMA20 tells us that short-term momentum is still aligned lower. Not because price is collapsing—but because attempts to rotate upward have lacked enough participation to reclaim momentum structure.
The combination of Below VWAP + Below EMA20 often creates a heavy tape.
That’s what we’re seeing here.
Not fast. Just heavy.
Derivatives Layer — Leverage Behavior
This session’s derivatives data is one of the clearest tells.
Funding is negative.
Open interest is falling.
Long/short ratios remain below equilibrium.
Derivatives Snapshot
| Metric | Reading |
|---|---|
| Funding Rate | -0.0042% |
| OI 1H Change | -1.15% |
| OI 24H Shift | -4.32% |
| Long/Short Ratio | 0.88 |
| Top Trader Ratio | 0.94 |
Negative funding tells us leveraged longs are paying less—or exiting.
Declining open interest confirms contracts are closing.
This is critical.
If price drops while open interest rises, that usually means aggressive new shorts entering.
That is not happening here.
Instead, price remains weak while open interest declines.
That suggests liquidation escape flow.
Participants are reducing risk rather than expanding it.
This weakens trend quality.
Liquidity Cluster Map
Liquidity remains concentrated in two major external zones.
Liquidity Concentration Zones
| Liquidity Cluster | Price Level |
|---|---|
| Long Liquidation Zone | $62,112.20 |
| Short Liquidation Zone | $63,240.40 |
| Largest Cluster Cap | $382,274 |
These zones act like magnets because they contain trapped leverage.
What matters here is distance.
Current price is significantly closer to the lower liquidity zone than the upper short cluster. That means the market remains structurally closer to vulnerable long inventory.
But no sweep has occurred yet.
That tells us the market remains unfinished.
No aggressive stop event has cleared either side.
Detection Matrix Module
The structural model currently shows bearish control, but without trend expansion.
Detection Matrix
| Detection Metric | Reading / Live Observation |
|---|---|
| OI 24H Shift | -4.32% |
| OI 1H Shift | -1.15% |
| Liquidation Alerts | 0 Blocks Flushed |
| BOS Status | No BOS |
| CHOCH Status | Neutral |
| Composite Confidence | 74% Bearish Control |
No Break of Structure (BOS) is important.
Because despite price weakness, the market has not produced a fresh structural failure.
This keeps the environment rotational.
Not broken.
Just compressed.
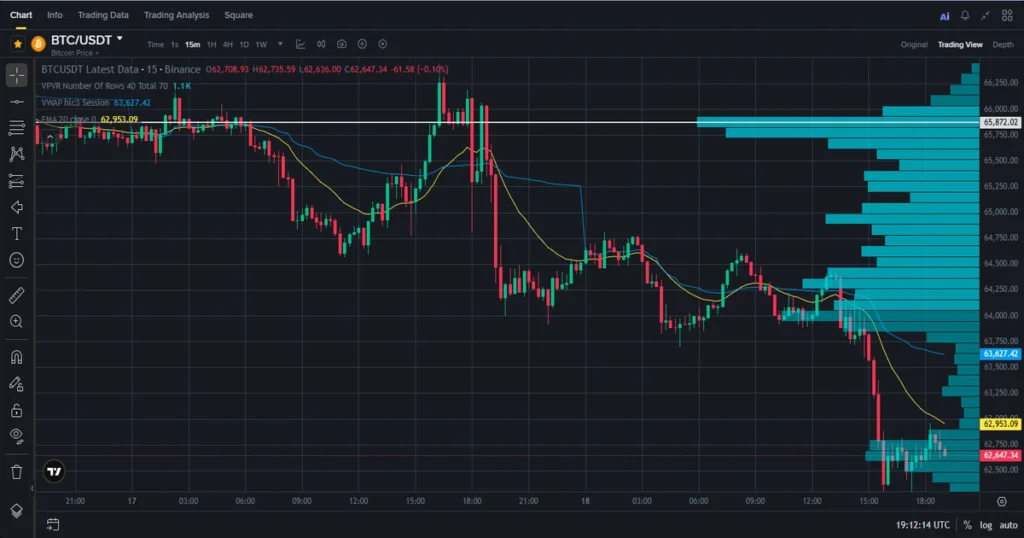
Key Technical Observations
- Session POC remains fixed at $62,786.00, above market.
- Bollinger Band Width is elevated at 3.01%, signaling active local volatility.
- Funding remains negative at -0.0042%, confirming leverage outflow.
- Net basis spread remains flat at $0.00, showing no premium distortion.
- No liquidation blocks flushed during the session.
- Total OI pool capacity remains near $99,586.14 USD.
- Binance dominates OI concentration at $41,826.18 USD.
- CME institutional participation remains the smallest among major venues.
- Buyer absorption remains visible but structurally weak.
- Sellers continue dominating the active tape.
FAQ Section
What does trading below VWAP indicate?
It means average session buyers are underwater, creating passive overhead supply.
Why does declining open interest matter?
It shows participants are closing positions rather than adding new exposure.
What does weak CVD strength mean?
It means positive buying flow exists, but lacks enough force to shift structural control.
Why is no BOS important?
Without a break of structure, the current framework remains intact.
Why does negative funding matter?
Negative funding often reflects long-side leverage reduction.
What does a flat basis tell us?
Spot and futures remain aligned, reducing arbitrage distortions.
Technical Conclusion
Bitcoin’s current session remains one of controlled compression rather than aggressive trend behavior.
Price continues operating below both VWAP and EMA20, maintaining localized seller control. Footprint data shows buyers are absorbing, but not dominating. Sellers remain active, though participation quality continues weakening through declining open interest.
The derivatives layer confirms leverage reduction.
The liquidity map remains intact.
No structural breaks.
No liquidation spikes.
No aggressive imbalance.
This is a market still rotating inside value, with inventory rebalancing continuing near lower session boundaries.
For active intraday traders, this type of tape demands patience more than speed.
The market is speaking.
Just quietly.
What was your best 15-minute setup today?
Financial Disclaimer
This article is for educational and market commentary purposes only. It is not financial advice, investment guidance, or a trading recommendation. Always do your own research before making trading decisions.

