

The capital allocation pipelines of the Western world did not achieve global institutional dominance by chance. They were forged through structural experiments, devastating systemic shocks, and massive technological leaps that continuously rewrote the rules of engagement for market participants. To truly grasp how institutional order flow, index arbitrage, and structural liquidity operate in the contemporary environment, one must examine the deep, iterative layers defining the history of dow jones index.
What began as a localized paper-and-pencil tracking initiative in the United States has transformed into a highly liquid, electronic benchmark closely monitored by global foreign institutional investors (FIIs). This transition was not a smooth progression, but rather a chaotic evolution propelled by intense market crises, structural exploits, and pivotal regulatory overhauls. For institutional desks, algorithmic traders, and market makers, reviewing this historical trajectory provides critical insights into order flow mechanics, value areas, and systemic liquidity transitions.
Every modern protocol, from the calculation of the continuous mathematical divisor to high-speed order routing at the New York Stock Exchange (NYSE), directly descends from these historical inflection points. Tracing this unique lineage reveals how the democratization of electronic data systematically dismantled physical, floor-based monopolies, permanently shifting global liquidity dynamics and turning the United States equity complex into an elite global wealth creator.
Featured Snippet Block
The history of dow jones index officially began on May 26, 1896, in the United States, when journalists Charles Dow and Edward Jones launched the Dow Jones Industrial Average (DJIA). Created to track the economic health of America’s industrial sector, the index originally averaged the stock prices of 12 foundational companies, establishing a simple arithmetic baseline of 40.94 points.
Key Takeaways from the History of Dow Jones Index
- Pioneered Indexation: Established the definitive baseline metric for pricing Western equity risk.
- Survived Systemic Crises: Endured massive structural market crashes, world wars, and technological shifts.
- Maintained Price-Weighting: Retained a unique price-weighted methodology rather than shifting to market capitalization.
- Democratized Global Wealth: Accelerated institutional and retail order flow convergence over three separate centuries.
The Structural Origins: Which Country Built the World’s Oldest Equity Barometer?
1896: Charles Dow, Edward Jones, and the United States Capital Expansion
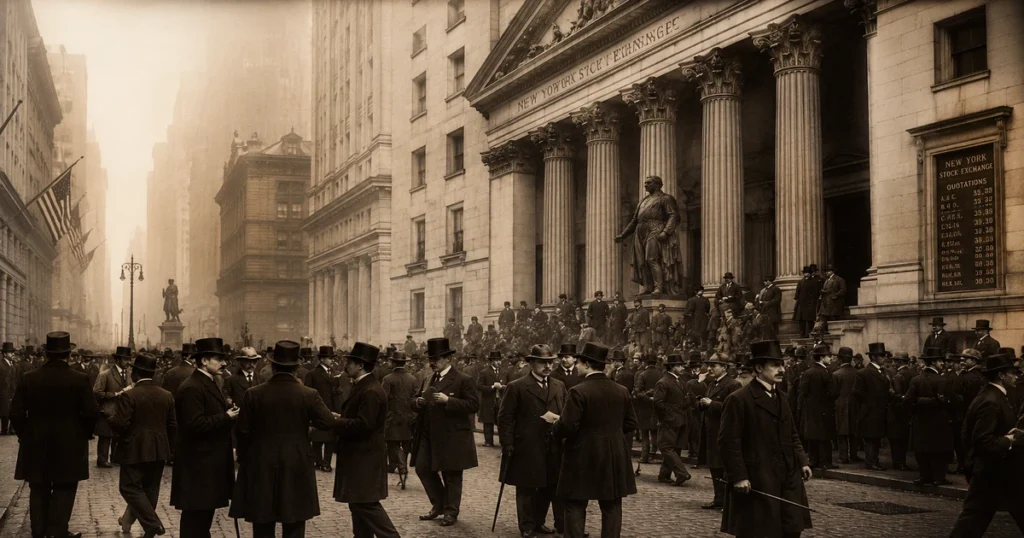
Long before automated order matching systems or digital clearing houses existed, price discovery in Western markets occurred through raw human interaction. In the late 19th century, the United States was rapidly transitioning from an agrarian economy into an industrial superpower. Railways, steel mills, and energy conglomerates were expanding at an unprecedented rate, but the market operated blindly without a reliable benchmark. This structural vacuum prompted the development of the Dow Jones Industrial Average, a tool designed by the founders of the Wall Street Journal to convert market noise into a legible mathematical signal. The early history of dow jones index was characterized by manual calculation loops, where changes in stock prices were tracked via physical chalkboards before being broadcasted to the open outcry floor.
The Twelve Original Titans: From General Electric to Distilling Legacies
To establish a statistically valid baseline, the creators selected 12 highly liquid, industrially representative enterprises. Among these original components were companies like American Cotton Oil, U.S. Leather, Distilling & Cattle Feeding, and General Electric. Every subsequent milestone in the history of dow jones index directly correlates to how these corporate profiles shifted. Over time, as smoke-stack factories gave way to consumer tech and software enterprises, the composition of the index adjusted, leaving General Electric as the longest-surviving original member until its eventual removal in 2018.
The Dangerous Inflection Points: Crises That Transformed the Index Structure
1929 and 1987: The Black Days of Structural Liquidity Sweeps
The structural integrity of Wall Street’s capital pipeline faced a devastating, bloody stress test in the early 20th century. The 1929 market crash injected massive, aggressive panic into the equity market. A closer inspection of the order book during this period reveals an absolute liquidity vacuum. The index plummeted, losing nearly 90% of its value from its pre-crash peak, marking the darkest chapter in the early history of dow jones index.

When the credit manipulation of the Roaring Twenties unraveled, the market faced an immediate, catastrophic systemic shock. A similar structural collapse occurred on October 19, 1987, known as Black Monday. On this single day, the index shed 22.6% of its value. This violent era in the history of dow jones index exposed the critical dangers of early programmatic computer trading loops. It forced global regulators to implement coordinated circuit breakers, permanently changing market microstructure by mandating temporary trading halts during periods of uncontrolled liquidity sweeps.
The Mathematical Flaw: Decoding the Mechanics of a Price-Weighted Index
Unlike modern benchmarks like the S&P 500 or the Nasdaq 100, which rank companies based on their total market value, the index stuck to its legacy roots. It remains a price-weighted index. This means a stock trading at $300 has a significantly larger impact on the index value than a stock trading at $30, regardless of the company’s actual enterprise scale. This structural eccentricity has caused intense debates across the modern history of dow jones index, as a minor percentage move in a high-priced stock can completely skew the intraday order flow dynamics of the entire index.
The Retailing Epoch: When Did Global Mass Investors Flood the Dow?
Post-WWII Capital Boom and the Mid-20th Century Retail Influx
If you ask veteran market historians which specific era fundamentally altered the user base of American equities, the definitive answer points to the post-WWII expansion. Prior to this period, stock trading was largely viewed by the general public as a dangerous, speculative gamble reserved strictly for elite institutional syndicates. The widespread democratization of corporate retirement plans and investment clubs in the 1950s and 1960s completely shattered this psychological barrier and marked a legendary turning point in the history of dow jones index.
The Modern Shift: Exchange Traded Funds (ETFs) and Automated Order Routing
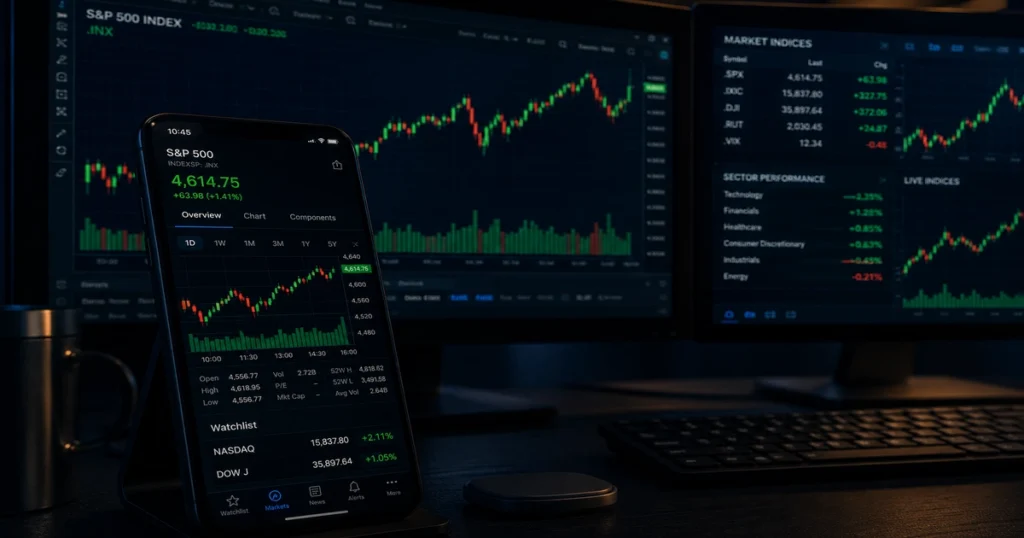
As technology advanced into the late 1990s, the introduction of the SPDR Dow Jones Industrial Average ETF (commonly known as “Diamonds” or $DIA) streamlined the entire onboarding flow for public capital. Common retail participants suddenly realized they could trade all 30 industrial components simultaneously with a single click. The launch of these liquid index products became a massive retail onboarding point in the modern history of dow jones index, introducing a wave of passive retail capital that systematically altered intraday order routing dynamics.
| Benchmark Era | Calculation Methodology | Primary Order Routing | Structural Risk Factors |
| 1896 Launch Era | Simple Arithmetic Average | Physical Floor / Ticker Tape | Manual Calculation Delays |
| Post-1929 Crash | Early Divisor Adjustments | Pneumatic Tubes / Open Outcry | Extreme Systemic Liquidity Vacuums |
| 1997 Component Shift | Modernized Dow Divisor | Early Screen-Based Routing | High-Priced Asset Distortions |
| Modern Algorithmic Era | Electronic Price Weighting | Co-located Automated HFT Servers | Algorithmic Flash Crashes, Sweeps |
Market Microstructure: How the Modern Index Functions
The Dow Divisor vs. Free-Float Market Capitalization Frameworks
A pivotal structural transition occurred in the history of dow jones index as corporate actions became more complex. When a constituent company executes a stock split, its individual share price drops instantly. Because the index is price-weighted, this split would artificially drag the entire index down if left unchecked.
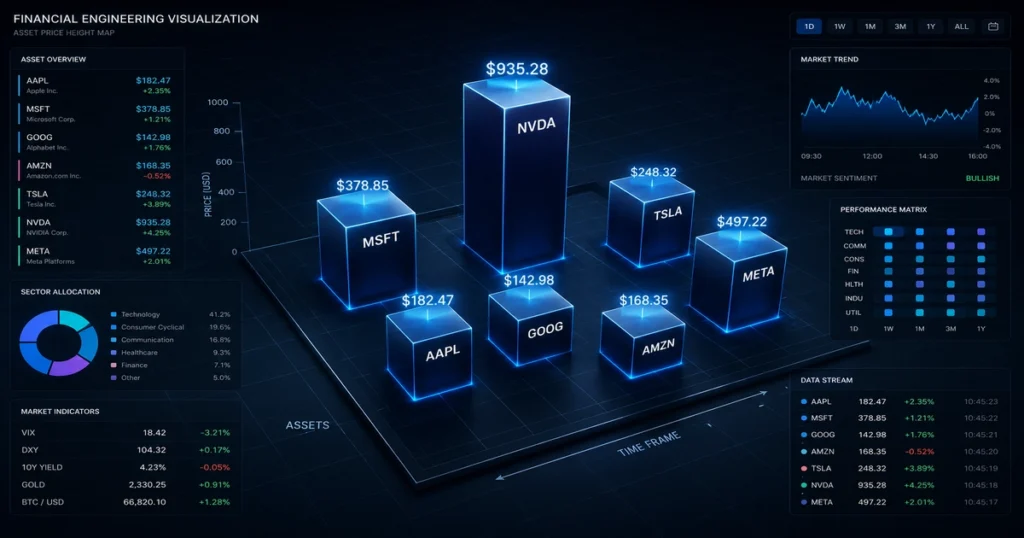
To prevent this structural distortion, the exchange utilizes a mathematical variable known as the “Dow Divisor.” Instead of dividing the sum of the stock prices by 30, the matching system divides the total by a continuously updated fraction. This calculation ensures that corporate actions like stock splits, spin-offs, or component replacements do not trigger artificial price gaps, protecting the long-term data integrity across the history of dow jones index.
Chronological Milestones: The Journey from Double Digits to Historic Highs
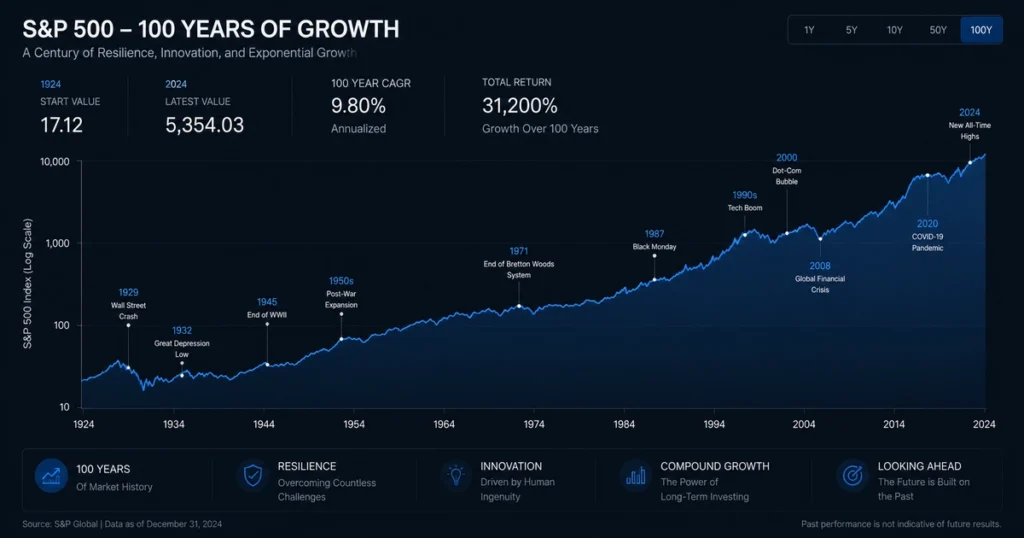
The long-term trajectory of the index serves as a stark visualization of global macroeconomic growth. Every single major structural resistance level broken over the decades reflects a distinct phase of underlying industrial and technological expansion tracked continuously across the history of dow jones index.
- 1906: The index breaches the 100 mark for the first time during early industrial manufacturing expansions.
- 1972: Crosses the 1,000 milestone as the post-war American economic machine scales up corporate output.
- 1999: Touches 10,000 during the peak of the early internet boom, highlighting intense structural buying pressure.
- 2017: Explodes past 20,000 as automated institutional order flow and low interest rates drive unprecedented liquidity.
- Modern Era Peak: Breaches historic territory deep past 40,000, solidifying its position as an elite global wealth creator.
Structural Architecture of the Price-Weighted Index Routing System
The following technical flowchart maps the path of execution capital from diverse investor segments through modern matching infrastructure to print the live index value.
[Retail Brokers / Apps]       [Institutional Desks]        [High-Frequency Algos]
           │                            │                            │
           ▼                            ▼                            ▼
   [FIX Protocol Layer]       [Direct Market Access]       [Co-located Server Nodes]
           │                            │                            │
           └────────────────────────────┼────────────────────────────┘
                                        ▼
                         [NYSE Arca Matching Architecture]
                                        │
                          ┌─────────────┴─────────────┐
                          ▼                           ▼
            [Price Priority Allocation]    [Continuous Divisor Processing]
                          │                           │
                          └─────────────┬─────────────┘
                                        ▼
                        [Real-Time Dow Jones Index Print]
                                        │
                                        ▼
                        [Dissemination to Global SIP]
Frequently Asked Questions About the History of Dow Jones Index
Why is the index price-weighted instead of market-cap weighted?
The index remains price-weighted purely due to its historical legacy. In 1896, advanced calculating systems did not exist. Charles Dow created a simple arithmetic system where adding stock prices and dividing them was the most efficient way to generate a real-time data signal. The index has maintained this structure to preserve historical continuity.
What exactly is the Dow Divisor and how does it work?
The Dow Divisor is a dynamic mathematical constant used to maintain index continuity. When a company splits its stock or changes its corporate structure, its nominal share price alters. The Divisor is adjusted downward to ensure these non-market actions do not create artificial price drops in the benchmark value.
Which country owns and regulates the Dow Jones Index?
The index originated in the United States and tracks companies listed on American exchanges (primarily the NYSE and Nasdaq). Today, it is managed and calculated by S&P Dow Jones Indices, a joint venture majority-owned by S&P Global.
How often are the 30 companies inside the index changed?
There is no fixed schedule for component rebalancing. A corporate selection committee reviews the index components periodically. Changes are usually triggered by shifts in corporate scale, mergers, bankruptcies, or when a company no longer accurately represents its underlying industry sector.
What was the single largest one-day drop in the history of dow jones index?
The largest single-day percentage decline occurred during the Black Monday crash on October 19, 1987. The index collapsed by 22.6% in a single session due to a massive cascade of automated sell programs that completely overwhelmed the available passive limit orders in the book.
Terminal Wrap-Up & Discussion
Analyzing the long history of dow jones index proves that market architecture is constantly adapting to technological realities. The index has successfully morphed from an informal newspaper calculation into an ultra-fast, world-class digital data pipeline. For modern algorithmic traders and long-term asset allocators, understanding these deep layers of structural history is absolutely vital to successfully navigating global market volatility.
How is your trading system managing the current intraday pricing distortions caused by high-priced constituents inside price-weighted indices? Let us know your workflow strategies in the comments below.
Educational Financial Disclaimer
This article is written entirely for educational, research, and historical context. It does not constitute financial advice, investment recommendations, or an endorsement to buy or sell any specific asset class. Equities carry high levels of structural risk and volatility. Past historical performance is never an indicator of future market results.

