

The capital allocation framework of the Indian subcontinent did not achieve global institutional scale by chance. It was carved through structural experiments, devastating systemic shocks, and massive technological leaps that continuously rewrote the rules of engagement for market participants. To truly grasp how institutional order flow, sweeping algorithms, and retail momentum operate in the contemporary environment, one must examine the deep, iterative layers defining the history of sensex.
What began as a localized quote tracking initiative has transformed into a highly liquid, electronic benchmark closely monitored by global foreign institutional investors (FIIs). This transition was not a smooth progression, but rather a chaotic evolution propelled by intense market crises, structural exploits, and pivotal regulatory overhauls. For institutional desks, algorithmic traders, and market makers, reviewing this historical trajectory provides critical insights into order flow mechanics, value areas, and systemic liquidity transitions.
Every modern protocol, from free-float market capitalization weights to high-speed order matching at the Bombay Stock Exchange (BSE), directly descends from these historical inflection points. Tracing this unique lineage reveals how the democratization of electronic data systematically dismantled physical, floor-based monopolies, permanently shifting global liquidity dynamics and turning India into an elite global wealth creator.
Featured Snippet Block
The history of sensex began with its official launch on January 2, 1986, by the Bombay Stock Exchange (BSE). Designed by analyst Deepak Mohoni, it serves as a market-capitalization-weighted benchmark index tracking 30 of the most financially sound, liquid, and representative stocks across key sectors, using a historical base year of 1978-79 calibrated at a base value of 100 points.
Key Takeaways from the History of Sensex
- Pioneered Indexation: Established the definitive baseline metric for pricing Indian equity risk.
- Survived Systemic Crises: Endured massive structural market crashes, regulatory overhauls, and security scams.
- Transitioned Weighting Models: Shifted from full market capitalization to a modern free-float methodology.
- Democratized Domestic Wealth: Accelerated institutional and retail order flow convergence over multiple decades.
The Structural Origins: Why and How the Index Was Created
1875–1986: Under the Banyan Tree to the Official Launch
Long before automated order matching systems or digital clearing houses existed, price discovery in Indian markets occurred through raw human interaction. In the mid-19th century, a small group of stock brokers gathered under a sprawling banyan tree in Mumbai to trade securities. This informal community eventually institutionalized into the Native Share & Stock Brokers’ Association in 1875, which later became the Bombay Stock Exchange.
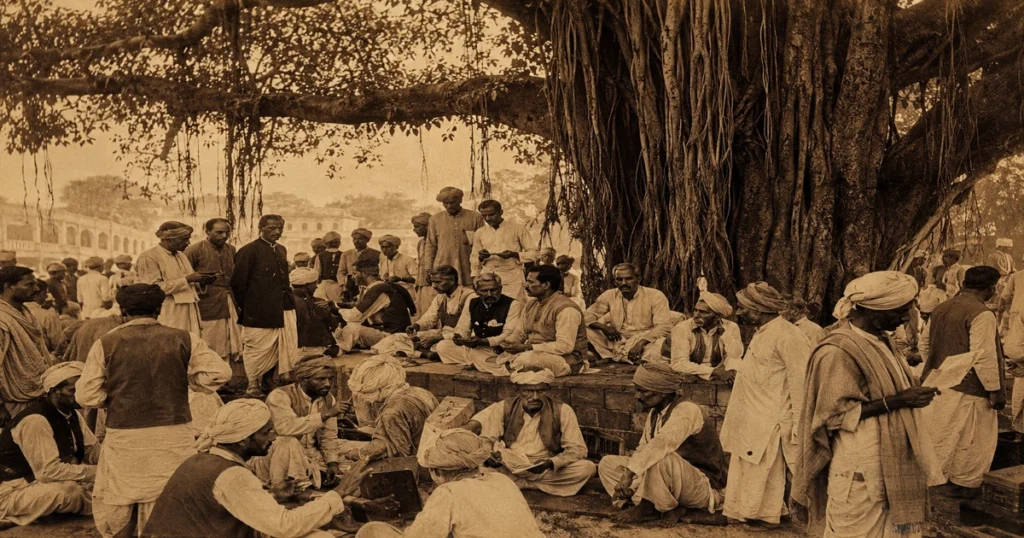
As industrial production expanded across post-independence India, institutional desks realized they lacked a standardized barometer to measure aggregate market health. The market operated blindly without a reliable benchmark. This structural vacuum prompted the development of the S&P BSE Sensex, a portmanteau of “Sensitive Index.” The early history of sensex was characterized by manual calculation loops, where changes in stock prices were tracked via physical ledgers before being broadcasted to the open outcry floor.
The Core Mathematics: How Base Year 1978-79 Calibrates the Index
To establish a statistically valid baseline, the creators looked backward to the financial year 1978-79. They assigned this period an arbitrary base value of 100 points. This mathematical anchor allowed the index to scale proportionately with the expanding capitalization of its underlying constituents.
Every subsequent milestone in the history of sensex directly correlates to this original mathematical calibration. Whenever an enterprise grew its market presence, the index adjusted its divisor to maintain structural consistency, ensuring that corporate actions like stock splits or bonus issues did not artificially distort the primary benchmark print.
The Dangerous Inflection Points in the History of Sensex
1992: The Harshad Mehta Liquidity Shock and Structural Vulnerabilities
The structural integrity of India’s capital pipeline faced a devastating, bloody stress test in the early 1990s. The 1992 banking system scam, engineered by inflating credit extensions, injected massive, aggressive liquidity into the equity market. A closer inspection of the order book during this period reveals an unsustainable asset bubble. The index surged aggressively, crossing the 4,000 mark in an unbacked frenzy that remains a critical chapter in the history of sensex.
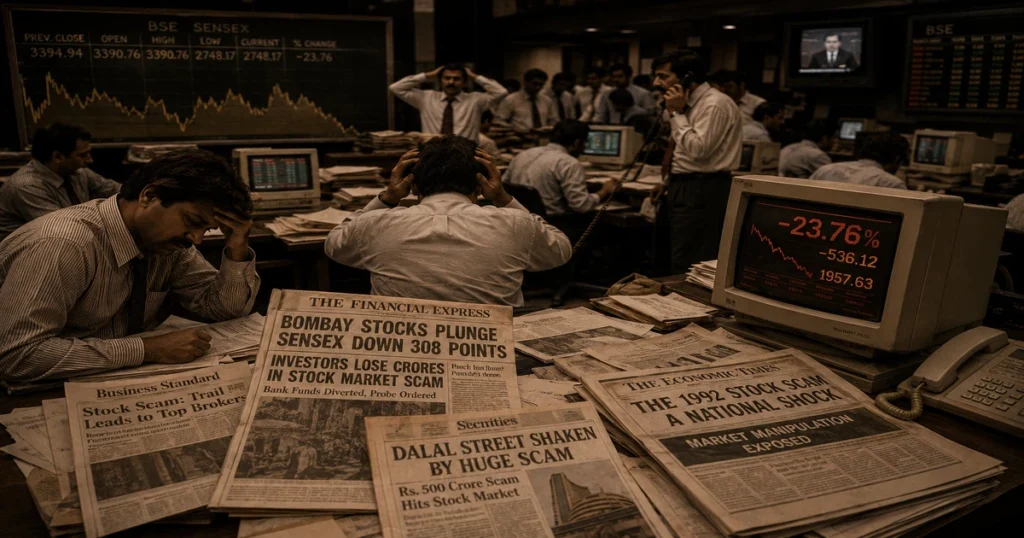
When the credit manipulation was exposed, the market faced an immediate, catastrophic liquidity vacuum. The subsequent crash wiped out vast sums of retail capital, forcing a massive multi-week exchange shutdown. This dark era in the history of sensex exposed the critical dangers of physical settlement loops. It forced the Indian government to accelerate the creation of the Securities and Exchange Board of India (SEBI) as a powerful statutory regulator, permanently changing market microstructure by mandating the shift toward dematerialized (electronic) trading.
2008 and 2020: Global Meltdowns vs. Domestic Resilience
The external macro vulnerabilities of the index became acutely visible during the 2008 Global Financial Crisis. As systemic contagion swept through western banking institutions, foreign portfolio flows reversed instantly. The index shed over 50% of its value within months as aggressive market orders overwhelmed passive limit orders at every visible price tier, testing the structural resilience in the history of sensex.
A similar macro shock occurred in March 2020, when pandemic panic caused a rapid, historic collapse, triggering automatic circuit breakers. Yet, what makes the recent history of sensex uniquely compelling is the rapid structural recovery that followed. The market did not remain trapped in a prolonged depression; instead, it orchestrated an unprecedented, aggressive V-shaped recovery driven by a fundamental shift in domestic institutional order flow.
The Retailing Epoch: When Did Common Mass Investors Flood the Market?
The 2020 Retail Explosion: Demat Democratization and Mobile Brokerages
If you ask veteran analysts which specific year fundamentally altered the user base of Indian equities, the definitive answer is 2020. Prior to this period, trading was largely viewed by the general public as a dangerous, speculative gamble, keeping the broad masses at bay. The widespread democratization of digital Demat accounts completely shattered this psychological barrier and marked a legendary turning point in the history of sensex.
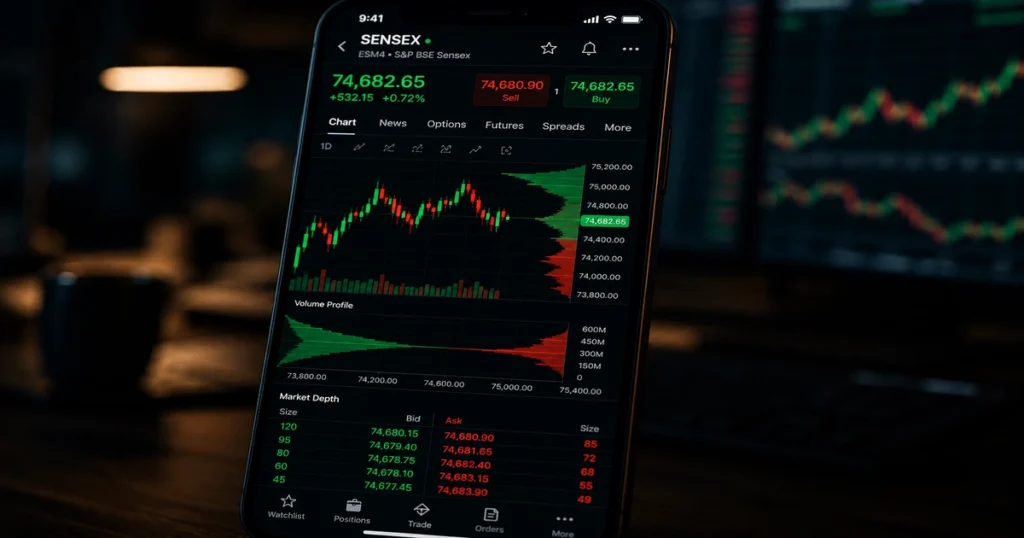
As millions of citizens found themselves restricted to their homes with smartphones during the pandemic lockouts, low-cost discount brokerages streamlined the entire onboarding flow. People suddenly realized that micro-investing and active trading were accessible directly from their touchscreens. The year 2020 became the single largest retail onboarding point in the entire history of sensex, introducing a massive wave of young, aggressive retail capital that systematically altered intraday liquidity dynamics.
Measuring the Shift in Cumulative Volume Delta and Passive Inflows
This massive influx of retail participants, paired with structural growth in domestic Systematic Investment Plans (SIPs), created a powerful counterweight to global capital volatility. Historically, when FIIs sold aggressively, the index collapsed. In the modern history of sensex, however, the Cumulative Volume Delta (CVD) shows that deep domestic institutional inflows regularly absorb heavy foreign selling pressure, establishing a much sturdier structural floor for the entire ecosystem.
| Benchmark Era | Calculation Methodology | Primary Order Routing | Structural Risk Factors |
| 1986 Launch Era | Full Market Capitalization | Physical Open Outcry / Phone | Badla Trading, Settlement Delays |
| Post-1992 Reform | Transition to Electronic | Early Screen-Based Terminals | Systemic Credit Volatility, Fraud Risk |
| 2003 Structural Pivot | Free-Float Capitalization | High-Speed Digital Networks | Global Subprime Contagion Exposure |
| Modern Algorithmic Era | Free-Float (Microsecond Priority) | Algorithmic / Co-Located Servers | Flash Crashes, High-Frequency Spikes |
Market Microstructure: How the Modern Index Functions
Free-Float Market Capitalization vs. Legacy Weighted Metrics
A pivotal structural transition occurred in the history of sensex on September 1, 2003, when the exchange formally abandoned the full market capitalization methodology. The legacy model was deeply flawed: it included shares held by promoters, government entities, and strategic cross-holdings that were never available for active public trading.
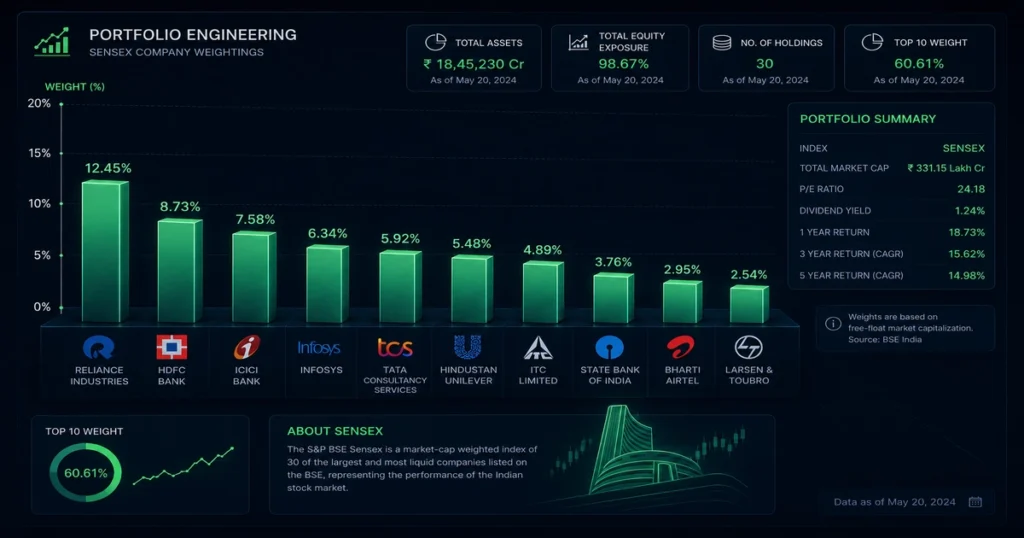
By shifting to a free-float market capitalization framework, the matching engine began calculating weights based purely on readily tradable shares. This adjustment drastically improved tracking efficiency for international index funds. It ensured that passive asset allocation strategies could execute large-scale portfolio rebalancing without triggering artificial price distortions or liquidity sweeps in tightly held corporate names, resolving an old conflict in the history of sensex.
Chronological Milestones: The Journey from 100 to Historic Peaks
The long-term trajectory of the index serves as a stark visualization of India’s macro growth story. Every single major structural resistance level broken over the decades reflects a distinct phase of underlying economic expansion tracked continuously across the history of sensex.
- 1990: The index breaches the 1,000 mark for the first time, driven by early industrial expansion hopes.
- 2006: Crosses the 10,000 milestone as economic liberalization policies attract vast foreign institutional pools.
- 2014: Touches 25,000 during a major political transition, highlighting intense structural buying pressure in the history of sensex.
- 2021: Explodes past 50,000 as the post-pandemic retail wave drives unprecedented domestic order flow.
- Modern Era Peak: Breaches the historic 80,000 territory, solidifying its position as an elite global wealth creator.
Structural Architecture of the Index Routing System
The following technical flowchart maps the path of capital from diverse investor segments through modern matching infrastructure to print the live index value.
[Retail Apps / Mobile]      [Domestic Mutual Funds]      [Foreign Portfolios (FII)]
          │                            │                             │
          ▼                            ▼                             ▼
  [API / FIX Gateways]      [Direct Market Access]       [Co-located Algo Nodes]
          │                            │                             │
          └────────────────────────────┼─────────────────────────────┘
                                       ▼
                       [BSE BOLT PLUS Matching Engine]
                                       │
                         ┌─────────────┴─────────────┐
                         ▼                           ▼
            [Free-Float Price Priority]     [Continuous Divisor Calc]
                         │                           │
                         └─────────────┬─────────────┘
                                       ▼
                       [Real-Time Sensex Index Print]
                                       │
                                       ▼
                        [Dissemination to Global SIP]
Frequently Asked Questions About the History of Sensex
Why was the year 1978-79 chosen as the base year for the index?
The financial year 1978-79 was chosen as the baseline because it represented a period of relative macroeconomic stability with no extreme systemic shocks, agricultural crises, or volatile pricing anomalies. This provided a clean, reliable mathematical anchor to calibrate the index’s starting value at 100 points.
What was the single biggest structural failure in the history of sensex?
The most significant structural crisis occurred during the 1992 Harshad Mehta banking scam. The exchange operated with physical settlement sheets and opaque broker-to-broker credit networks. When the unbacked liquidity bubble burst, it forced extended exchange shutdowns and triggered massive regulatory intervention to transition the market to electronic settlement.
How did the shift to free-float capitalization in 2003 protect investors?
The shift to a free-float framework ensured that companies with massive promoter holdings but very few shares available to the public could not unfairly manipulate the index’s movements. It aligned the index’s behavior with actual, tradable market liquidity, drastically reducing tracking errors for institutional funds.
What role did the year 2020 play in changing investor demographics?
The year 2020 acted as the ultimate demographic turning point. The combination of home isolation during lockdowns, rapid smartphone penetration, and paperless digital KYC onboarding allowed millions of common retail citizens to open Demat accounts instantly, permanently increasing domestic retail participation.
How are individual stocks selected to be a part of the Sensex 30?
Stocks are selected based on strict liquidity, trading frequency, sector representation, and market capitalization criteria. A company must be listed on the Bombay Stock Exchange for a minimum duration, maintain an active daily trading history, and represent fundamentally sound pillars of its industry sector.
Terminal Wrap-Up & Discussion
Analyzing the long history of sensex proves that market architecture is constantly adapting. The index has successfully morphed from an informal gathering under a tree into an ultra-fast, world-class digital trading pipeline. For modern algorithmic traders and long-term asset allocators, understanding these deep layers of structural history is absolutely vital to successfully navigating emerging market volatility.
How is your trading system managing the current intraday liquidity swings between domestic mutual funds and foreign institutional desks? Let us know your workflow strategies in the comments below.
Educational Financial Disclaimer
This article is written entirely for educational, research, and historical context. It does not constitute financial advice, investment recommendations, or an endorsement to buy or sell any specific asset class. Emerging market equities carry high levels of structural risk and volatility. Past historical performance is never an indicator of future market results.

