

Exploring the history of stock market indices reveals how statistical indicators transformed from simple mathematical averages into the absolute benchmarks of global wealth. Today, a single glance at a flashing red or green number—whether it is the Dow Jones, S&P 500, Nifty 50, or Nasdaq 100—tells investors exactly how the corporate world is performing.
But before the long history of stock market indices began, investors had a massive blind spot.
They could track individual company shares, but they had absolutely no data-driven method to measure the overall health, direction, or momentum of the entire broader market.
The comprehensive history of stock market indices is essentially the story of data democratization. It represents the transition from blind emotional speculation to highly structured, algorithmic asset allocation. These mathematical baskets of stocks have funded industrial expansions, built global corporate benchmarks, and paved the way for modern passive investing via index funds and ETFs.
To fully understand how international financial systems price risk and balance capital flows, we must pull back the layers of time to analyze the complete, global history of stock market indices.
Global Stock Market Indices at a Glance
| Metric | Historical Insight | Modern Macroeconomic Significance |
| First Ever Stock Index | Dow Jones Transportation Average (1884) | Formed the absolute structural blueprint for market tracking. |
| First Capitalization-Weighted Index | S&P 90 / evolved to S&P 500 (1957) | Introduced market-cap weighting, capturing real corporate proportions. |
| World’s Premier Tech Indicator | Nasdaq 100 Index (Launched 1985) | Tracks the global digital ecosystem and high-growth innovation. |
| India’s First Official Index | S&P BSE Sensex (Launched 1986) | The historic barometer of the corporate Indian economic story. |
| India’s High-Volume Derivatives Hub | NSE Nifty 50 (Launched 1996) | The primary benchmark powering modern Indian algorithmic trading. |
| Europe’s Leading Industrial Tracker | DAX Performance Index, Germany (1988) | Measures the export-driven corporate core of the European Union. |
1. The Birth of Market Indicators: Charles Dow and the Genesis of Tracking
To understand how the history of stock market indices officially commenced, we must travel back to late 19th-century New York. The year was 1884, and Wall Street was a chaotic, unregulated arena. Thousands of individual stocks fluctuated wildly based on rumors, insider manipulation, and market panics. Investors faced a severe structural challenge: there was no uniform method to answer the simplest question in finance: “Is the stock market as a whole moving up, or is it moving down today?”
A brilliant financial journalist named Charles Dow, who along with his partner Edward Jones founded Dow Jones & Company, stepped forward to solve this problem. Charles Dow realized that while tracking every single listed company was impossible for ordinary citizens, he could select a specific, representative basket of core companies and track their combined average performance over time, creating a monumental turning point in the history of stock market indices.
[ 1884: The Blueprint ] -> Charles Dow creates the Transportation Average with 11 stocks.
  │
  ▼ (Focus shifts to factories)
[ 1896: The Industrial Average ] -> 12 core industrial stocks are added together and divided by 12.
  │
  ▼ (The Structural Evolution)
[ Modern Price-Weighted Dow ] -> Uses a complex "Dow Divisor" to adjust for corporate stock splits.
The First Index: The Dow Jones Transportation Average (1884)
In 1884, Charles Dow rolled out the world’s very first stock market index: the Dow Jones Transportation Average. This initial index contained just 11 stocks—9 of which were booming railroad companies, which were the technological engines driving American expansion at the time. By adding the closing prices of these 11 companies together and dividing the sum by 11, Dow created a baseline mathematical average.
The Legend Arrives: The Dow Jones Industrial Average (1896)
As America rapidly transitioned from a rail-centric economy into a massive manufacturing powerhouse, Charles Dow recognized that railroads no longer captured the full picture of national productivity. On May 26, 1896, he launched the legendary Dow Jones Industrial Average (DJIA) with 12 foundational industrial companies, including General Electric, US Leather, and American Cotton Oil.

Initially, calculating the index was simple arithmetic. However, as companies enacted stock splits or corporate mergers, the simple mathematical division threatened to distort the historical baseline. To preserve the integrity of the history of stock market indices, Wall Street introduced the Dow Divisor—a continuously adjusted mathematical denominator that shields the index from arbitrary price distortions caused by corporate restructuring.
The Dow Jones established that a small, calculated basket of stocks could serve as a highly accurate proxy for an entire nation’s economic trajectory.
2. S&P 500: The Evolution of Capitalization Weighting
While the Dow Jones Industrial Average revolutionized the financial world, as the mid-20th century approached, mathematical purists and institutional economists exposed a major flaw in its architecture: the Dow was, and remains, a price-weighted index.
In a price-weighted system, companies with a higher raw nominal share price exert a disproportionate influence over the index’s direction, regardless of the actual size of the corporation. For instance, if a tiny company with a $500 stock price drops by 10%, it damages a price-weighted index significantly more than a massive, multi-billion-dollar corporate giant whose raw stock price happens to be $50. This structural distortion drove the next massive evolution in the history of stock market indices: the rise of the S&P 500.
                        ┌───────────────────────────────┐
                        │      S&P 500 WEIGHTING        │
                        └───────────────┬───────────────┘
                                        │ Market-Cap Model
                ┌───────────────────────┴───────────────────────┐
                ▼                                               ▼
     [ Outstanding Shares ]                            [ Total Market Value ]
     Multiplied directly by current                     Determines the true percentage
     market price per share.                           influence of a stock in the index.
The Birth of the Cap-Weighted Standard (1957)
In 1957, a financial data firm called Standard & Poor’s engineered a superior statistical solution by launching the S&P 500 Index. The S&P 500 introduced a highly advanced market-capitalization-weighted model to the global history of stock market indices.
To calculate a company’s market capitalization, the index matrix multiplies its total outstanding public shares directly by its current market price. Therefore, the weight of each stock inside the index is perfectly proportional to its actual corporate value in the real world.
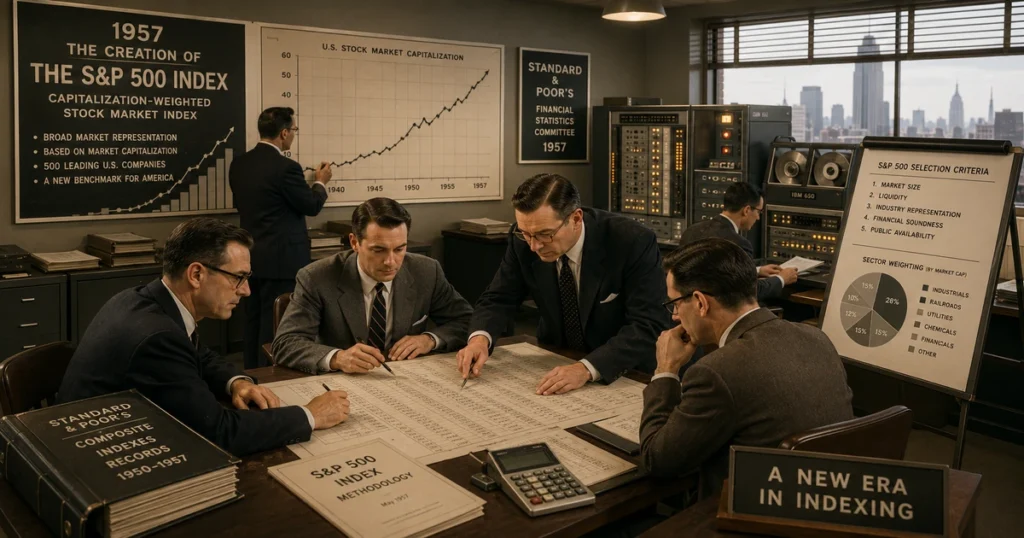
The introduction of the S&P 500 completely altered how professional money managers evaluated investment performance:
- The Ultimate Benchmark: It became the definitive institutional gauge for the US equity market, tracking 500 of the largest, most stable corporations across 11 distinct economic sectors.
- The Foundation of Passive Investing: In the 1970s, legendary investor John Bogle utilized the S&P 500 index structure to launch the world’s first retail index fund (Vanguard), proving that simply buying the entire index outperformed the vast majority of expensive, actively managed mutual funds over the long term.
3. Nasdaq 100: The Tech Sector and the Digital Index Era
As the global economy transitioned out of heavy industrial manufacturing into the early phases of the digital age, the financial system required a brand-new type of indicator. In 1971, the National Association of Securities Dealers automated trading quotes, creating the Nasdaq.
However, it was the launch of the Nasdaq 100 Index in 1985 that permanently redefined the history of stock market indices for the high-growth technology era.
Unlike the NYSE-dominated S&P 500 or the traditional Dow, the Nasdaq 100 was engineered specifically to track the 100 largest, non-financial domestic and international corporations listed on the Nasdaq stock market. It deliberately excluded traditional commercial banking and insurance giants, opening its arms to highly speculative, capital-intensive innovation sectors.
[ 1971: The Electronic Hub ] -> Nasdaq launches the world's first digital quotation network.
  │
  ▼ (Focus on structural growth)
[ 1985: Nasdaq 100 Formed ]  -> Baskets the top 100 non-financial firms, excluding banking.
  │
  ▼ (The Modern Dot-Com Titan)
[ High-Growth Tech Tracker ] -> Heavily dominated by mega-cap digital giants like Apple and Nvidia.

The Nasdaq 100 became a hyper-reactive barometer for the global electronic trading revolution and the rise of the dot-com era. Throughout the late 1990s, the index experienced an astronomical speculative surge driven by early internet startups, followed by a historic, bone-chilling 80% collapse when the dot-com bubble finally burst in 2000.
Yet, as resilient tech powerhouses like Apple, Microsoft, Amazon, Google, and Nvidia rebuilt the global economy from the ground up, the Nasdaq 100 roared back to life, cementing its status as the absolute premier metric for tracking high-growth digital innovation in the modern history of stock market indices.
4. India’s Financial Barometers: The Story of Sensex and Nifty 50
The narrative of capital indicators on the Indian subcontinent is a brilliant chapter in the global history of stock market indices. India’s economic journey from a closed, socialist-leaning state into a multi-trillion-dollar free-market powerhouse is perfectly charted across its two flagship stock market indices: the S&P BSE Sensex and the NSE Nifty 50.
                           ┌─────────────────────────┐
                           │ INDIA'S TWIN INDICATORS │
                           └────────────┬────────────┘
                                        │ Market Trackers
         ┌──────────────────────────────┴──────────────────────────────┐
         ▼                                                             ▼
  [ S&P BSE Sensex (1986) ]                                   [ NSE Nifty 50 (1996) ]
  Tracks 30 blue-chip stocks on Dalal Street;                 Baskets 50 highly liquid stocks;
  Asia's oldest benchmark indicator.                          The supreme arena for derivative volumes.
The Pioneer: S&P BSE Sensex (1986)
On January 1, 1986, the Bombay Stock Exchange officially introduced India’s very first equity index: the BSE Sensex (Sensitivity Index). Brainchild of market analyst Deepak Mohoni, the Sensex was designed to track 30 of the largest, most financially stable, and highly liquid blue-chip companies listed on Dalal Street, across multiple sectors of the Indian economy.

Initially calculated using a standard market-cap weighting system, the Sensex later transitioned to a free-float market capitalization methodology in 2003, ensuring that the index only calculated shares that are actively available for public trading, excluding promoter holdings. The historical chart of the Sensex serves as a stunning visual representation of India’s post-1991 economic liberalization, capturing the country’s rapid wealth generation in real-time.
The Derivatives King: NSE Nifty 50 (1996)
In 1996, the newly formed National Stock Exchange launched its own competing flagship index: the NSE Nifty 50 (National Index Fifty). The Nifty 50 baskets 50 of the premier Indian corporate giants across major economic sectors, serving as a highly diversified macroeconomic indicator.
The Nifty 50 rapidly established a massive global reputation due to its structural design:
- The Foundation for Derivatives: The Nifty 50 became the ultimate global arena for high-volume options and futures trading, allowing institutional global investors to speculate on or hedge against the broader Indian consumer story.
- Algorithmic High-Speed Integration: Backed by the NSE’s fully computerized, satellite-linked electronic systems, the Nifty 50 became the primary engine driving automated, high-frequency quantitative trading across the subcontinent, adding a highly liquid, tech-driven chapter to the history of stock market indices.
5. The United Kingdom and the FTSE 100
Moving across the globe to Europe, the history of stock market indices is anchored heavily by the financial networks of the United Kingdom. In 1984, a joint venture was established between the Financial Times and the London Stock Exchange, resulting in the creation of the FTSE 100 Index (affectionately nicknamed “The Footsie”).
The FTSE 100 tracks the 100 largest blue-chip corporate entities listed on the London Stock Exchange by market capitalization. However, the FTSE 100 possesses a highly distinct structural personality that separates it entirely from technology-heavy indices like the Nasdaq.
[ LSE Base ] -> FTSE 100 launches in 1984, tracking the top 100 UK listed corporations.
  │
  ▼ (The Sector Reality)
[ Commodity Heavy ] -> Deeply concentrated in global banking, mining, energy, and tobacco.
  │
  ▼ (Global Exposure)
[ International Revenue ] -> Generates over 70-80% of its corporate profits outside British borders.
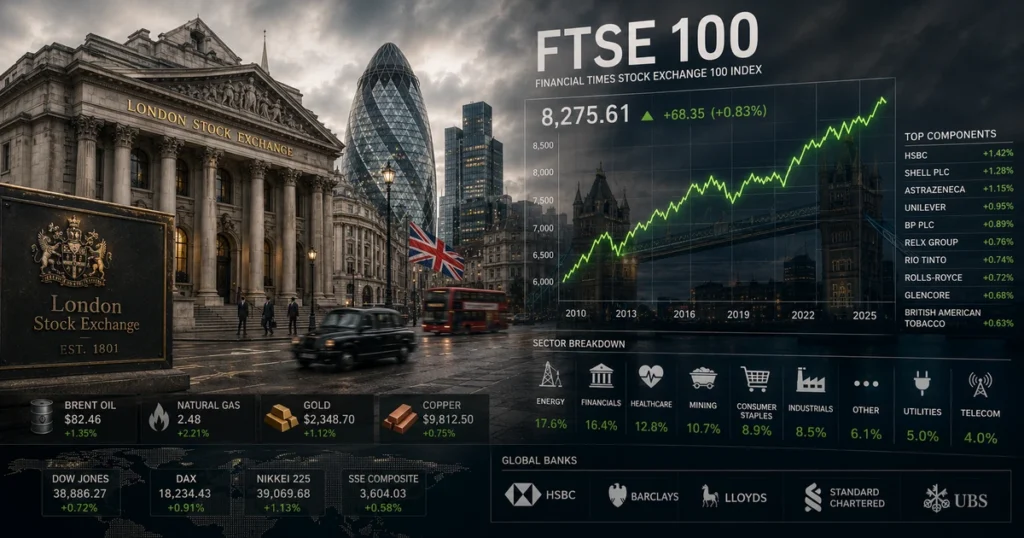
Because of London’s deep, historical ties to international mercantile trade, the FTSE 100 is highly concentrated in massive, old-world value industries—including global banking giants, traditional energy titans, multinational tobacco conglomerates, and diversified raw material mining corporations.
Crucially, the companies inside the FTSE 100 generate over 70% to 80% of their total corporate profits completely outside the borders of the United Kingdom, turning the index into a highly sensitive global macro gauge rather than a simple indicator of localized British economic health, a unique dynamic within the global history of stock market indices.
6. Japan’s Nikkei 225: Tracking the Asian Industrial Giant
In the Asian theater of the history of stock market indices, the absolute titan is Japan’s Nikkei 225. Launched formally in 1950 by the Nihon Keizai Shimbun (Japan Economic Newspaper), the Nikkei 225 is calculated using a price-weighted methodology remarkably similar to the American Dow Jones Industrial Average.
The Nikkei 225 tracks 225 of the premier, blue-chip corporations that drove Japan’s historic post-WWII industrial miracle—including global automotive legends like Toyota, electronic pioneers like Sony, and advanced industrial robotics manufacturers.
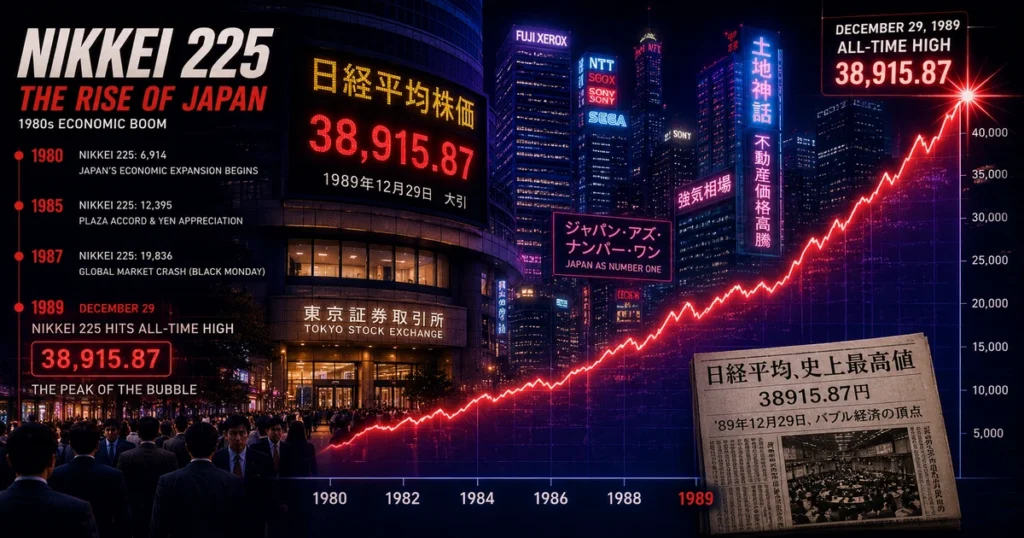
The historical trajectory of the Nikkei 225 contains a profound lesson regarding market psychology and structural asset bubbles:
- The Speculative Peak (1989): Driven by rampant real estate speculation and cheap credit, the Nikkei 225 exploded to an astronomical record high of 38,915 points in December 1989.
- The Catastrophic Crash: When the Japanese asset bubble finally burst, the Nikkei plummeted into a devastating, decades-long bear market, wiping out trillions of dollars in paper wealth.
- The Multidecadal Recovery: The Nikkei took more than three long decades of structural economic adjustments, corporate restructurings, and massive central bank equity purchase programs to finally surpass its 1989 bubble peak, demonstrating the intense structural scars that unchecked speculation can leave across the history of stock market indices.
7. Germany’s DAX: The European Industrial Powerhouse
Germany approached the implementation of market indicators with its signature engineering precision. On July 1, 1988, the Frankfurt Stock Exchange officially rolled out the DAX Performance Index (Deutscher Aktienindex).
Initially tracking 30 (now expanded to 40) major blue-chip corporations, the DAX represents the absolute industrial and automotive core of the European Union—basketing world-class engineering, chemical, and manufacturing giants like Siemens, Bayer, SAP, Allianz, and Volkswagen.
                           ┌─────────────────────────┐
                           │   GERMAN DAX FIELDS    │
                           └────────────┬────────────┘
                                        │ Performance Model
                 ┌──────────────────────┴──────────────────────┐
                 ▼                                             ▼
       [ Dividend Reinvestment ]                     [ Pure Capital Gains ]
       Automatically assumes all corporate            Unlike the S&P 500, it folds cash
       payouts are bought back into stocks.           distributions back into index points.
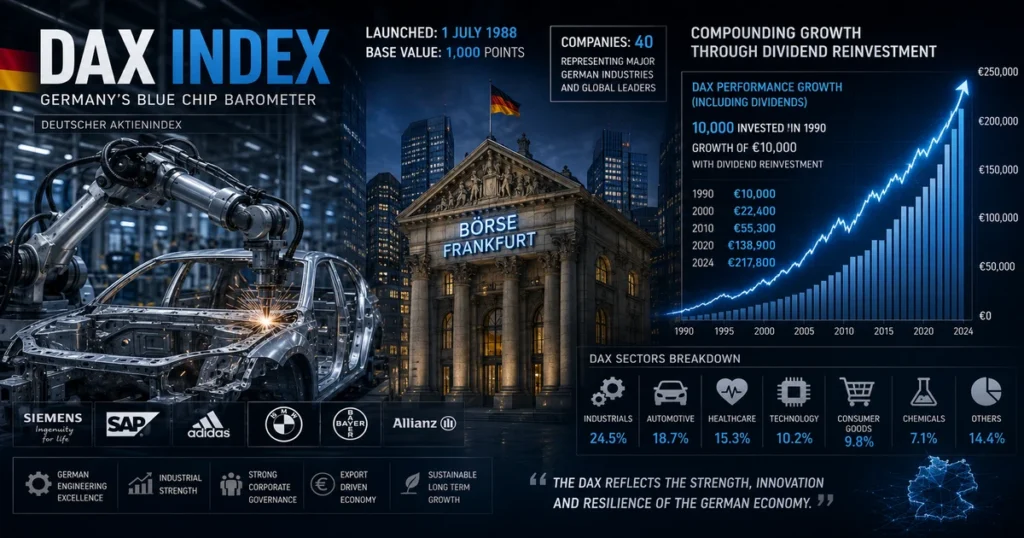
The DAX introduced a highly distinct mathematical feature that separated it from many Western indicators in the history of stock market indices: it is calculated primarily as a Performance Index.
While standard price indices (like the price-returns version of the S&P 500) only track the capital gains of stock prices, the total-return DAX mathematically assumes that all corporate cash dividends are automatically reinvested directly back into the index’s components. This structural design ensures that the DAX captures the complete, compounding total economic performance of Germany’s corporate export machine.
8. Australia’s ASX 200: A Resource and Inflow Titan
The southern hemisphere’s contribution to the global history of stock market indices is anchored cleanly by the S&P/ASX 200 Index. Launched in 2000 by Standard & Poor’s in partnership with the Australian Securities Exchange, the ASX 200 tracks the 200 largest highly liquid institutional corporations listed within Australian borders.
The ASX 200 possesses a unique macroeconomic personality driven by the country’s rich natural geology and distinct social policies.
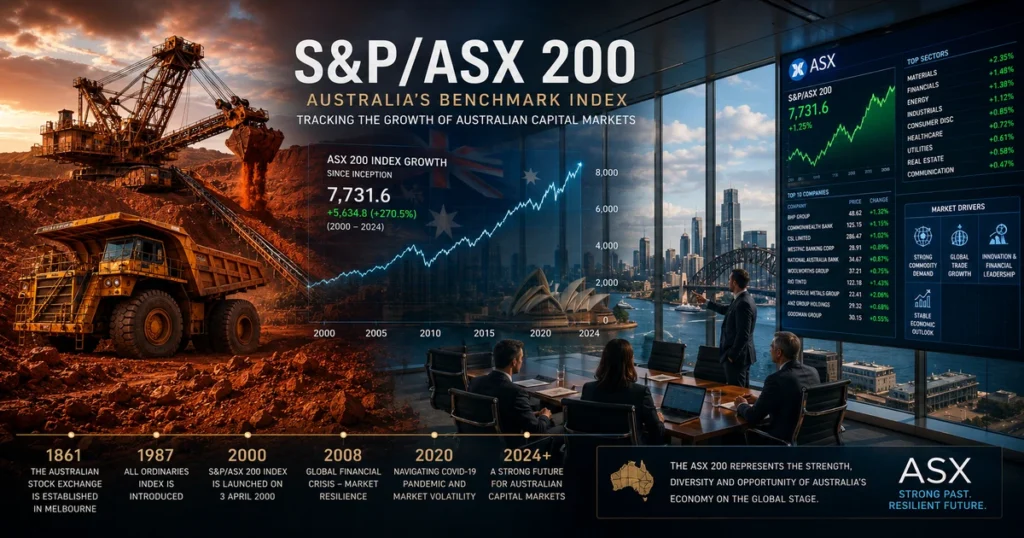
The structural performance of the ASX 200 is guided by two massive sectoral pillars:
- Natural Resource Superpowers: The index is heavily weighted with massive, diversified global mining and energy extraction corporations like BHP Group and Rio Tinto, making the ASX 200 a primary liquid proxy for global commodity cycles and Asian infrastructure demands.
- The Superannuation Capital Wall: Backed by Australia’s unique 1992 Superannuation policy—which legally commands employers to deposit a fixed percentage of every worker’s salary directly into investment funds—the ASX 200 is supported by a permanent, non-stop wall of institutional inflows, creating an incredibly stable capital ecosystem within the history of stock market indices.
9. Canada’s S&P/TSX Composite: The Commodity-Heavy Anchor
Completing our global tour of foundational indicators, Canada’s entry in the history of stock market indices is the S&P/TSX Composite Index. Serving as the premier benchmark for the Toronto Stock Exchange, this index tracks the performance of Canada’s largest listed corporations, capturing roughly 70% of the entire market capitalization of the nation’s equity universe.
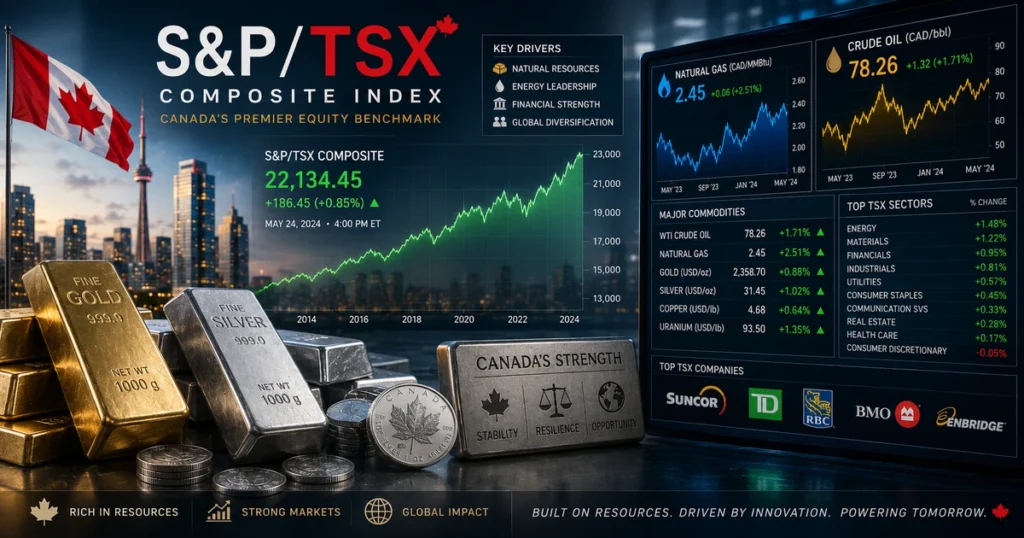
The S&P/TSX Composite Index features a heavy structural concentration that reflects Canada’s unique northern economy:
- The Resource & Banking Duopoly: The index is highly dominated by two massive sectors—financial institutions (Canada’s ultra-stable big banks) and natural resources (oil sands operators, natural gas drillers, and gold mining enterprises).
- Commodity Sensitivity: Unlike technology-driven indices like the Nasdaq, the TSX Composite rises and falls in lockstep with international commodity pricing, serving as an essential global indicator for raw material inflation and energy supply security.
The Master Matrix of Global Stock Market Indices
| Rank | Indicator | Primary Country | Weighting Type | Structural Focus Sector |
| 1 | S&P 500 | United States | Market-Cap Weighted | Large-Cap Blended (Tech, Healthcare, Finance) |
| 2 | Dow Jones (DJIA) | United States | Price-Weighted | Blue-Chip Industrial and Corporate Giants |
| 3 | Nasdaq 100 | United States | Modified Market-Cap | High-Growth Technology and Digital Innovation |
| 4 | NSE Nifty 50 | India | Free-Float Cap | Diversified Emerging Market Growth Hub |
| 5 | S&P BSE Sensex | India | Free-Float Cap | Ultra-Liquid Core Blue-Chips (Dalal Street) |
| 6 | FTSE 100 | United Kingdom | Market-Cap Weighted | International Value (Banking, Mining, Tobacco) |
| 7 | Nikkei 225 | Japan | Price-Weighted | Electronics, Automotive, Advanced Robotics |
| 8 | DAX 40 | Germany | Free-Float Cap (Total Return) | Export-Driven Engineering and Heavy Industry |
| 9 | S&P/ASX 200 | Australia | Float-Adjusted Cap | Diversified Mining, Energy, and Domestic Banking |
| 10 | S&P/TSX Comp | Canada | Float-Adjusted Cap | Energy Production, Gold Mining, Financials |
Key Historical Observations
- Charles Dow Birthed the Field: The entire history of stock market indices began with Dow’s realization that a calculated subset of rail and industrial stocks could act as a proxy for a nation’s total output.
- Market-Cap Weighting Brought Accuracy: Standard & Poor’s eliminated the price-weighting distortions of the Dow by launching the S&P 500, matching stock weights to actual corporate value.
- Nasdaq Tracked the Silicon Frontier: The Nasdaq 100 deliberately sidelined traditional banking firms to construct a high-volatility, high-growth indicator tailored for software and digital infrastructure.
- Sensex Measured Indian Modernization: Launched on Dalal Street in 1986, the 30-stock Sensex became the definitive long-term chart tracking India’s historic economic liberalization.
- Nifty 50 Kinged Derivative Trading: The NSE engineered the Nifty 50 to interface cleanly with computerized electronic matching engines, transforming it into a high-volume global hub for financial derivatives.
- FTSE 100 Anchored Imperial Value: London’s flagship index operates as a highly sensitive global macro gauge, extracting the vast majority of its revenues outside UK borders.
- Nikkei Warned Against Asset Bubbles: The historic 1989 speculative spike and subsequent multidecadal crash of Japan’s premier price-weighted index stands as a permanent warning to global finance.
- Germany Pioneered Total-Return Tracking: The DAX altered standard indexing conventions by automatically compounding cash dividends back into the performance points of the index.
- Australia Linked Indexing to Retirement: The ASX 200 combines global commodity sensitivities with a steady, legally enforced flow of universal worker Superannuation capital.
- TSX Comp Serves as a Material Shield: Canada’s primary composite index provides global portfolios with a highly concentrated vehicle to hedge against raw material and energy inflation.
FAQ Section
What was the absolute first indicator in the history of stock market indices?
The Dow Jones Transportation Average, created by Charles Dow in the United States in 1884, stands as the absolute first stock market index in human history, initially tracking 11 core transportation companies.
Why did the S&P 500 introduce market-capitalization weighting?
The S&P 500 introduced capitalization weighting in 1957 to fix the flaws of price-weighted indices like the Dow. Market-cap weighting ensures that a company’s impact on the index is perfectly proportional to its actual size, outstanding shares, and total market value.
Which is the oldest official stock market index in Asia?
The S&P BSE Sensex, launched by the Bombay Stock Exchange in Mumbai, India, in 1986, holds the title of the oldest official equity benchmark index on the Asian continent.
What is the primary difference between the Nifty 50 and the Sensex?
The BSE Sensex tracks 30 blue-chip stocks listed on the Bombay Stock Exchange, whereas the NSE Nifty 50 tracks 50 highly liquid stocks listed on the National Stock Exchange. While both utilize free-float market-cap weighting, the Nifty 50 serves as the primary high-volume arena for financial derivatives and options trading.
How does Germany’s DAX differ from standard Western price indices?
Germany’s DAX is structured primarily as a Performance Index (Total Return). Unlike standard price indices that ignore cash distributions, the DAX automatically assumes all corporate dividends are instantly reinvested back into the index stocks, compounding its long-term growth chart.
Why do institutional macro traders monitor stock market indices over individual shares?
Professional traders monitor stock market indices because these baskets eliminate the specific operational risks of individual companies. They provide clean, real-time data regarding systematic risk, economic growth vectors, asset allocation flows, and broader market sentiment.
Final Perspective
The global history of stock market indices is, at its deepest statistical core, the history of how humanity maps and visualizes collective economic wealth.
These mathematical baskets completely transformed the face of modern capitalism. They took a highly complex, chaotic maze of individual corporate stock prices and streamlined them into clean, scannable, real-time indicators of human productivity. They provided the foundational architecture that allowed central bank technocrats to measure economic stability, enabled massive institutional pension funds to hedge systemic risks, and empowered ordinary middle-class savers to build wealth passively alongside the world’s greatest corporations.
From Charles Dow’s original pencil-and-paper tracking of 19th-century American railroads to the high-speed, algorithmic server grids that calculate the Nifty 50, S&P 500, or Nikkei 225 at the microsecond level today, the index has continuously evolved to match the velocity of global capital.
As we march forward into an era dominated by automated passive index algorithms, thematic sector tracking, and algorithmic multi-asset global baskets, the core reality remains completely unchanged.
National stock market indices are far more than mere numbers flickering on a digital screen. They are the living, breathing mathematical scorecards of human civilization—and they will continue to track, measure, and define the flow of global economic wealth for generations to come.

