

Introduction
BTC/Bitcoin is currently trading inside a compressed rotational structure, where directional expansion remains absent despite localized intraday buyer control. Price continues holding above both VWAP and EMA20, keeping session buyers structurally profitable, but derivatives positioning tells a more cautious story underneath.
What stands out in this execution window is the divergence between spot strength and futures positioning. Fresh short exposure continues entering the tape while volatility remains restricted, creating a squeeze-like environment where both sides are defending liquidity rather than forcing expansion.
The broader liquidity environment remains balanced, with no major liquidation flushes recorded and order flow staying rotational rather than aggressive.
Observed Runtime: Binance UTC Live Feed
Market Snapshot Table
| Market Metric | Live Reading |
|---|---|
| Asset Pair | BTCUSDT |
| Current Price | $66,097.99 |
| Session POC | $65,553.10 |
| Value Area High | $65,684.21 |
| Value Area Low | $65,421.99 |
| EMA20 Position | Above EMA20 |
| VWAP Position | Above VWAP |
| Liquidity Regime | Volatility Compression |
| Bollinger Width | 1.00% |
| Active Liquidations | 0 Blocks |
| Structural State | Bullish Consolidation |
Active Structural Conditions
| Execution Signal | Status |
|---|---|
| 🟢 Above VWAP | Session Buyers Holding Profit |
| 🟢 Above EMA20 | Local Support Accepted |
| 🟠 New Short Injection | Seller Pressure Rising |
| ⚪ Liquidity Regime | Compression |
| ⚪ No BOS | Structure Still Rotational |
| ⚪ No Sweep | Liquidity Untouched |
Intraday Boundary Check (At A Glance)
Price remains positioned $544.89 above Session POC, showing localized buyer control inside the intraday value zone.
That matters because POC represents where the heaviest transaction acceptance happened. Trading above it means buyers still dominate fair value.
| Boundary Layer | Reading |
|---|---|
| Current Price | $66,097.99 |
| POC | $65,553.10 |
| Distance Above POC | $544.89 |
| Resistance Cluster | $66,692.90 |
| Support Cluster | $65,503.10 |
15-Min Live Execution & Trend Breakdown
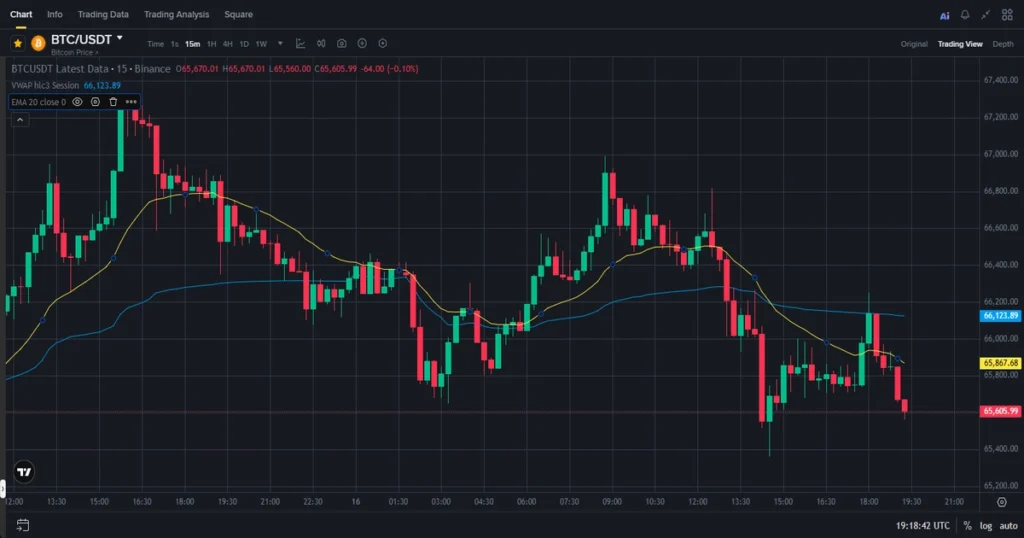
The 15-minute Smart Money Structure still prints bullish continuation, but that bullish state remains structurally shallow.
No BOS.
No CHOCH.
No sweep.
That tells us participants are still operating in defensive mode.
Buyers are holding higher, but not pressing aggressively.
Sellers are absorbing.
This type of tape usually reflects hesitation near active liquidity.
Footprint confirms that.
Buy-side absorption printed +23.43 BTC, while seller aggression printed -29.82 BTC, leaving a net delta of -6.39 BTC.
That imbalance matters.
It shows sellers were the more active aggressors despite price holding higher.
Institutional Gravity — EMA20 & VWAP Interaction
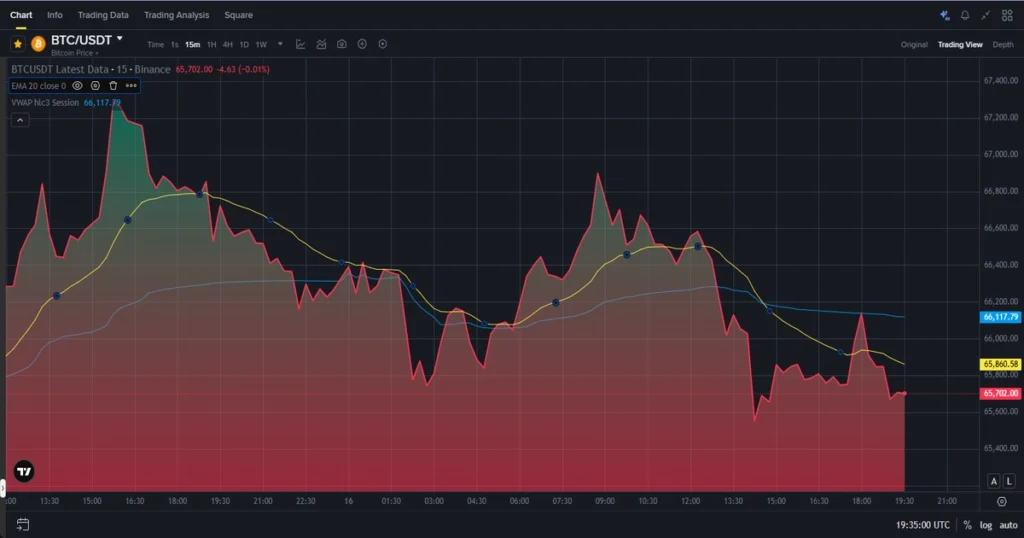
BTC remains above both key intraday gravity lines.
That keeps the short-term tape technically supportive.
| Gravity Metric | Position |
|---|---|
| EMA20 | Below Price |
| VWAP | Below Price |
| Market State | Buyer-Controlled Rotation |
Trading above VWAP means the average executed buyer during this session remains in profit.
That often keeps passive bids stable.
Trading above EMA20 means short-term momentum remains defended.
But there’s a catch.
Price above these levels while new shorts continue building often creates internal tension between tape strength and derivatives conviction.
That tension is visible here.
Detection Matrix Module
The derivatives layer gives the clearest institutional read.
Open interest expanded +2.41% in the last hour and +8.76% over 24 hours.
At the same time, CVD remains only +0.29.
That imbalance matters.
Fresh positioning entered, but spot participation stayed weak.
That usually reflects leverage-led activity.
| Detection Metric | Reading |
|---|---|
| Open Interest 1H | +2.41% |
| Open Interest 24H | +8.76% |
| Funding Rate | +0.0087% |
| CVD | +0.29 |
| Classification | New Shorts Injected |
This confirms a structurally important detail:
Derivatives traders are more active than spot buyers right now.
Key Technical Observations
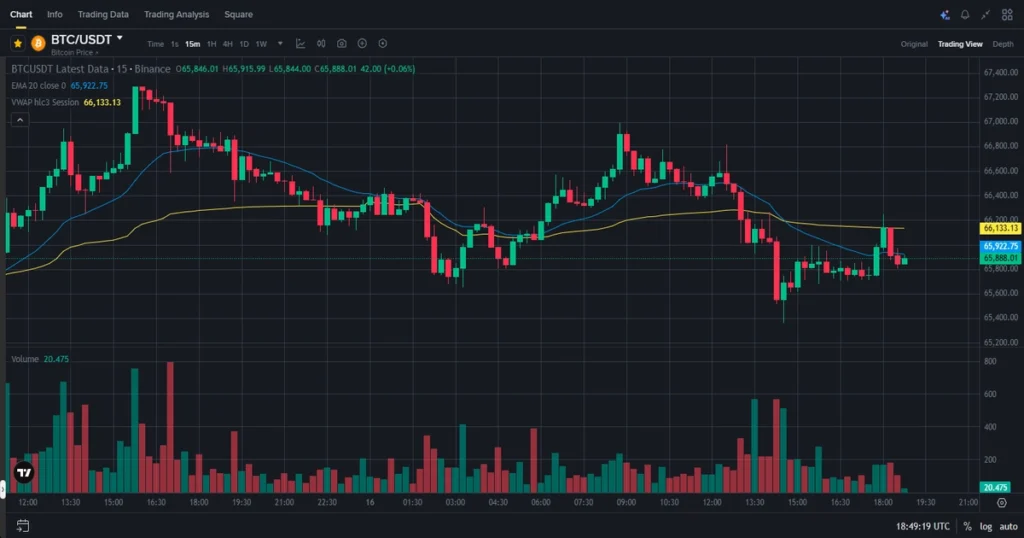
Volatility remains restricted.
Bollinger bandwidth at 1.00% shows tight price compression.
That means range participation remains active, but conviction remains low.
Liquidation maps also remain stable.
No flushes.
No stop cascades.
Heatmap clusters remain intact:
| Liquidity Cluster | Price |
|---|---|
| Long Cluster | $65,503.10 |
| Short Cluster | $66,692.90 |
These zones continue acting as liquidity magnets where passive traders are clustered.
The larger cluster size of $186,911 shows concentration remains heavy.
That often creates sticky price behavior.
FAQ Section
Why does trading above VWAP matter?
It means the average session buyer remains profitable, which often supports passive buying.
What does rising open interest with weak CVD show?
It usually reflects leveraged positioning entering faster than spot demand.
Why is no BOS important?
Without Break of Structure, price remains rotational rather than directional.
What does volatility compression mean here?
It means price is moving in a tight bracket while liquidity builds on both sides.
Technical Conclusion
BTC remains in a tight structural squeeze where intraday buyers still control the visible tape, but fresh short positioning continues building underneath.
Price acceptance above VWAP, EMA20, and Session POC keeps the local structure stable, yet footprint aggression remains seller-led.
The tape right now reflects hesitation.
Not weakness.
Not strength.
Just compression.
That’s usually where the market reveals who is truly defending size.
What was your best 15-minute setup today?
Financial Disclaimer
This article is for educational and market commentary purposes only. It is not financial advice, investment guidance, or a trading recommendation. Always do your own research before making trading decisions.

